
Vizuly Scatter Plot
将散点图图表添加到您的 JavaScript 应用中。
Vizuly Professional includes all Vizuly components at a significant discount.
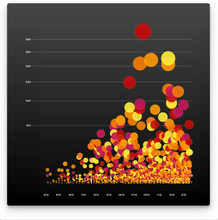
Vizuly Scatter Plot shows 3 dimensions of data at once by plotting values along both the x and y axis as well as the radius of the plot itself. Each plot can be colored and styled dynamically based on your data.


图像1/5
Features
Framework Adapters
Vizuly Scatter Plot亦以___提供
透过Live Chat与我们的Vizuly 专家联络!
联系电话: (888) 850 9911
传真: +1 770 250 6199


