官方供应商
我们作为官方授权经销商,直接提供超过200家开发厂家所发行超过1000个的产品授权给您。
查看我们的所有品牌。

说明: Create cross-platform charting apps for desktop and mobile with C# and XAML. TeeChart NET for MAUI allows you to build powerful charting applications targeting iOS, Android, macOS and Windows from one common C# codebase which helps.NET MAUI developers ... 阅读更多

说明: Lightweight and full featured, cross-platform grid / tabular control. TeeGrid offers a very fast grid component for Embarcadero RAD Studio, Delphi and C++, VCL and Firemonkey frameworks and Lazarus FreePascal. Fully compatible with VCL and FMX it offers ... 阅读更多

说明: JavaScript/HTML/PDF Organizational Chart, Family & Dependencies Diagrams. Basic Primitives Diagram is a 100% JavaScript component library for building general purpose and organizational diagrams without manual nodes layout. It works in all major ... 阅读更多

说明: Scheduling, diagramming, charting, mapping and User Interface components for ASP.NET applications. MindFusion.ASP.NET Pack helps you create applications that include diagrams, charts, schedules, maps and a rich user interface. Each of the controls is ... 阅读更多

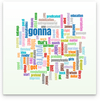
说明: Add Word Clouds to your JavaScript apps. Vizuly Word Cloud is a unique way to represent the occurrence rate of words within a given text stream. This visualization supports an exclusion list that will ignore common pronouns, profanity, or any words you ... 阅读更多

说明: Grids, Diagramming, Scheduling, Charts and UI for JavaScript apps. MindFusion.JavaScript Pack includes interactive JavaScript libraries that are easy to use and easy to customize. Users can perform a variety of actions on any of the JavaScript components ... 阅读更多

说明: 为.NET 框架设计的数据分析、可视化和处理组件。 SharpShooter Collection represents a comprehensive pack of.NET components for BI applications development. The package includes the use-proven reporting and OLAP components for data reporting and analysis; charting and gauges ... 阅读更多

说明: Build next-generation, fluent UI apps for any Windows Platform. Ultimate UI for WinUI lets you build native, high-performance, modern experiences that target all Windows devices on Microsoft’s newest UX framework. Ultimate UI for WinUI brings business ... 阅读更多

说明: Visualize all your business or operational data stored anywhere in SharePoint. Collabion DataParts helps you find insights from all your data stored in SharePoint. The easy-to-use interface allows you to quickly visualize data, explore patterns, monitor ... 阅读更多

说明: Create digital dashboards and reports in SharePoint. Nevron Data Visualization technology for Microsoft SharePoint Server is designed to provide exceptional reporting and dashboarding features to SharePoint IT professionals. Nevron Vision for SharePoint ... 阅读更多