資料視覺化元件 - 最暢銷的
找到293 產品
結果類型 篩選器:
-

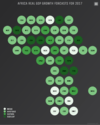
截圖: Highmaps- Tile map, circles (Dark Unica theme) 閱讀詳情 顯示關於這個產品的更多結果
-
截圖: Highmaps- Rich information on click (Sand Signika theme) 閱讀詳情
-
截圖: Highmaps- Zoom to area by double click (Sand Signika theme) 閱讀詳情
-
2. TeeSuite for RAD Studio
品牌: Steema Software主要類別: 資料視覺化元件
截圖: Create one multi-platform project using Embarcadero's RAD Studio and by using the same TeeChart component you can reach Windows, Linux, iOS, Android and macOS. 0 ... 閱讀詳情 顯示關於這個產品的更多結果
-
截圖: A Surface Series that offers plots of 3 dimensional data. 0 ... 閱讀詳情
-
截圖: The Activity Gauge offer the means to compare task goals (100%) and current status (percentage shown by each task band). 0 ... 閱讀詳情
-
3. DevExpress Universal
品牌: DevExpress主要類別: 展示層元件
截圖: 0 ... 閱讀詳情 顯示關於這個產品的更多結果
-
截圖: 0 ... 閱讀詳情
-
截圖: 0 ... 閱讀詳情
-
4. DevExpress DXperience
品牌: DevExpress主要類別: 展示層元件
截圖: 0 ... 閱讀詳情 顯示關於這個產品的更多結果
-
截圖: 0 ... 閱讀詳情
-
截圖: 0 ... 閱讀詳情
-

截圖: Vector plot (Dark Unica theme) 閱讀詳情 顯示關於這個產品的更多結果
-
截圖: Bell curve (Dark Unica theme) 閱讀詳情
-
截圖: Polygon series (Dark Unica theme) 閱讀詳情
-
6. DevExpress WinForms
品牌: DevExpress主要類別: 展示層元件
截圖: 0 ... 閱讀詳情 顯示關於這個產品的更多結果
-
截圖: 0 ... 閱讀詳情
-
截圖: 0 ... 閱讀詳情
-

截圖: With 80+.NET chart types and DirectX rendering, FlexChart's data visualizations will bring life to your apps. Top features include flexible data binding, annotations, scrolling, and analysis features.-174 ... 閱讀詳情 顯示關於這個產品的更多結果
-
截圖: Create stunning stock visualizations with the powerful financial chart component.-173 ... 閱讀詳情
-
截圖: Deliver quick and beautiful reports for your business applications, complete with data visualization and code-free report building.-172 ... 閱讀詳情
-
8. DevExpress ASP.NET and Blazor
品牌: DevExpress主要類別: 展示層元件
截圖: 0 ... 閱讀詳情 顯示關於這個產品的更多結果
-
截圖: 0 ... 閱讀詳情
-
截圖: 0 ... 閱讀詳情
-
9. DevExtreme Complete
品牌: DevExpress主要類別: 展示層元件
截圖: 0 ... 閱讀詳情 顯示關於這個產品的更多結果
-
截圖: 0 ... 閱讀詳情
-
截圖: 0 ... 閱讀詳情
-
10. DevExpress WPF
品牌: DevExpress主要類別: 展示層元件
截圖: 0 ... 閱讀詳情 顯示關於這個產品的更多結果
-
截圖: 0 ... 閱讀詳情
-
截圖: 0 ... 閱讀詳情


