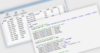
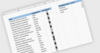
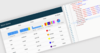
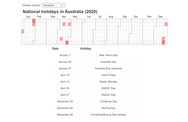
Build responsive, interactive JavaScript data grids and tables.
Aggregation - ZingGrid has default behaviors for calculating the average, count, min, max, and sum values for a given column. These aggregation values are displayed in a single row at the base of the grid.
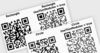
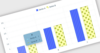
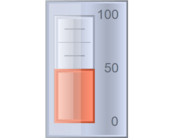
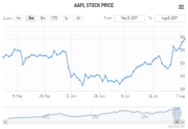
Stunning JavaScript charts for your website or Web application.
Chart Types for Every Need - Comes with an impressive array of chart types that provide beautifully rendered visuals. It also includes real-time charts that users can interact with, and extensive small chart support optimized for thousands of charts per page.