by JetBrains - Product Type: Add-In / Application
dotTrace Performance by JetBrains
URLs: dottrace, jetbrains
A profiling solution for profiling the performance of your .NET applications. 
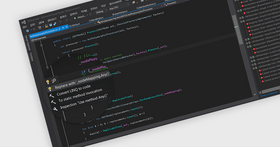
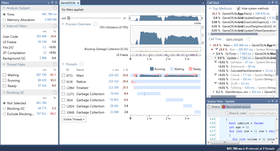
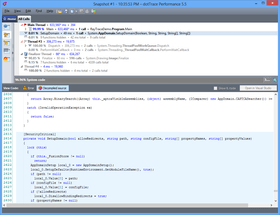
dotTrace profiles the performance of .NET applications, ASP.NET applications running on Internet Information Server and Windows services. You can compare any two performance snapshots of the same application with dotTrace. dotTrace program interface features effective navigation, easy filtering and smart search options. dotTrace also features source preview.
dotTrace Performance Features:
Take advantage of efficient navigation, easy filtering, smart search and handy source preview.
Navigate from a function in snapshot directly to source file
Launch dotTrace from Visual Studio 2005, 2008, or 2010.
Profile CLR 4 applications
Profile Silverlight 4 applicationsly
Profile line-by-line
Find out line-level timings for your application's functions.
Use line-by-line profiling selectively if you like.
Every millisecond counts. Use the "High Accuracy" mode to account for the time spent inside the profiler.
Profile applications remotely with an automatic utility.
Profile Windows Mobile apps for .NET Compact Framework 3.5
Remote Profiling
Profile the performance of applications targeting .NET Framework 1.0 to 4.0, or .NET Compact Framework 3.5.
Profile complex desktop and server applications.
Process snapshots of up to several hundred GB in size.
Apply textual annotations to selected functions.
Save annotations with snapshots to review them later on.
Immediately estimate how removing a bottleneck would affect overall performance -- without recalculating your snapshot.
Performance profiling features in dotTrace Performance
Top-class technology support - dotTrace Performance provides a fast way to profile the performance of .NET applications based on .NET Framework 1.x to 4.0, .NET Compact Framework 3.5, and Silverlight 4.dotTrace Performance is able to profile standalone desktop applications, Web applications running under IIS or Visual Studio development server, Windows services, smart device applications, remote applications, and unit tests.
Server-scale snapshot support - dotTrace Performance is able to profile huge applications and get snapshots of several hundred gigabytes while still working at an acceptable speed. That means, you can use dotTrace Performance for profiling complex desktop and server applications.
Tracing profiling is a very accurate way of profiling that involves getting notifications from the CLR whenever it enters or exits a function. The time between these two notifications is taken as the execution time of the function. Tracing profiling helps you learn precise timing information and the number of calls on the function level.
Sampling profiling is a profiling method which is up to 30 times faster than tracing profiling, but at the expense of lower accuracy. It is extremely useful for at least two profiling scenarios: first, quickly getting a general idea of your application's performance, and second, profiling for extensive periods of time, up to many hours long.
Line-by-line profiling collects timing information for every statement in a function that has source code available. This lets you collect detailed information about functions that perform significant algorithmic work. You can specify exactly which functions you want to be profiled line-by-line or profile all functions which dotTrace Performance is able to locate symbol information for. In addition, dotTrace Performance provides a 'High Accuracy' flag to account for the time spent inside the profiler. When every millisecond counts, dotTrace pays attention.
Local or remote profiling - dotTrace Performance Professional Edition can connect to a remote machine to profile a standalone or Web application, or a Windows service. You don't even have to install dotTrace there — just copy a couple of files.
Convenient data representation - A number of informative views (Call Tree, Hot Spots, Threads Tree and more) allow convenient inspection of profiling data stored in snapshots. The importance of each function call is represented with descriptive icons, along with precise execution times and other relevant information. You can open functions in individual tabs, easily navigate views with keyboard shortcuts, focus on relevant calls, and create profiling reports by saving views to an external file.
Instant estimation of performance gains - dotTrace Performance is able to recalculate a snapshot instantly — without reprofiling your application. It's like asking the profiler: "what if I optimize this function by 40%?". Just call Edit | Adjust Time and specify the new time for the function or for all functions in a particular class. Time values for the entire snapshots will be recalculated.
Comparing performance snapshots - dotTrace Performance is able to compare any two performance snapshots of the same application. It generates a comparison snapshot which shows the difference in the number of calls and times consumed by each function. Comparison snapshots can be viewed and analyzed the same way as regular performance snapshots.
Quick function info - You can look up Quick Info on any function from the Call Tree view. The lookup window provides a summary of function statistics with respect to the selected call and to all calls in the current tab.
Filtering and formatting - dotTrace Performance lets you hide functions of little importance from a snapshot and highlight those that really make a difference. Filter out system calls and other non-essential functions with a combination of different filters. To emphasize important functions or classes of functions, use custom formatting rules.
Folding calls - In addition to filtering and formatting, dotTrace Performance provides another way to see all the data you want to see and none that you don't.
Fold filtered calls - Chains of filtered calls can be set to be folded by default or folded/unfolded manually. Recursive call chains can be folded to display the aggregate timings and call counts of all functions called recursively. You can hide functions that only call other functions but don't do any calculation on their own.
Annotating snapshots - During performance analysis, you may want to leave a comment about a function and its behavior. dotTrace Performance provides textual annotations for functions that are saved with the snapshot and can be reviewed later.
Search and navigate function calls - You can quickly locate functions and navigate to them. When searching for a function, you can type in the function name using CamelHumps, just like you do in ReSharper. You can highlight all occurrences of the function in the current view and then navigate between them with a simple press of a key.
Visual Studio integration and source code preview - dotTrace Performance provides a two-way integration with Visual Studio 2005, 2008, and 2010, allowing you to profile your applications right from the IDE, or view suspicious source code right from the profiler (and open it in Visual Studio for editing.) Run dotTrace Performance from Visual Studio: With a single button click, you can launch profiling or your startup project directly from Visual Studio. In addition, if you have ReSharper installed in your Visual Studio, you can easily start profiling unit tests from the code editor. Open a file from dotTrace Performance in Visual Studio — if your solution is opened in Visual Studio, you can click a button in the Preview Source tab to navigate to the corresponding source file in Visual Studio.
What’s new in dotTrace Performance 5.0?
Improved remote profiling - HTTP is now used for remote profiling instead of a custom protocol, which allows profiling over VPNs and simplifies configuring firewall rules. Also, both IPv4 and IPv6 are now supported for remote profiling.
IIS Express - Support for IIS Express complements existing support for the full-fledged IIS and ASP.NET Development Server.
Improvements in Plain List View - Choose to show or hide system functions from the Plain List View, and group functions by assembly in addition to class and namespace groupings.
Running Processes - Attach the profiler to an existing .NET Framework 4.0+ process and run sampling performance analysis on it.
Integrated decompiler - While profiling an application, if you need to dig further into the code but you don't have source code or symbol information at hand, dotTrace 5 Performance will decompile it for you instantly and present decompiled code in its source preview area for quick review.
Easier estimation of performance gains - The Adjust Time functionality used to estimate how optimizing a certain function affects timings of the entire snapshot has been improved.
Enhancements and additions for supported frameworks - Ensures seamless profiling of applications that contain code targeting different CLR versions. For example, if you have a .NET Framework 4.0 application that is dependent on external libraries targeting CLR 2, this application can now be perfectly profiled.
What's new in dotTrace Performance 4.5.2?
The latest minor update enables profiling of unit tests by integrating with a variety of recent versions of ReSharper, including 6.1, 6.0, and the 5.x family.
What's new in dotTrace Performance 4.5?
Less noise in call stacks and improved tree presentation - Content in snapshot views is now better organized: specifically, icons to the left of the tree no longer misalign its nodes. In addition, you can now quickly fold or unfold calls that take insignificant time with Ctrl+Space.
Extracting all public methods of a class to a single tab - You can now quickly view all public method calls from a certain class in a separate tab, which helps analyze the performance of a class along the lines of its API.
Improved estimation of potential performance gains - You can now adjust time of a function called from a specific parent function, leaving its other calls intact.
Sampling profiling is now used by default - Sampling is the fastest profiling mode that imposes least overhead. Of course, whenever you need to collect more detailed performance data, you can switch to tracing or line-by-line profiling.
Previewing .NET Framework source code - By connecting dotTrace 4.5 Performance to Microsoft Reference Source Server (via View | Options | Source Preview), you can preview the source code of .NET Framework when you analyze the behaviour of library code in your snapshot.
Displaying IL code in source view - In the Source Preview area, you can now switch between source form and CIL form of methods that you're analyzing:
New floating license handling policy - This is an important change for customers who are using dotTrace integrated into Visual Studio in corporate environments. Before, a floating license ticket was issued right upon loading the dotTrace plug-in in Visual Studio irrelevant of whether a user actually needed it. Starting from dotTrace 4.5 Performance, a ticket is only requested after a user has performed an operation with dotTrace from within Visual Studio.
Performance improvements - dotTrace 4.5 Performance generates Hot Spots and Plain List views a lot faster than version 4.0. Acceleration has also been applied to search in Hot Spots view and canceling view construction on pressing Esc.
A profiling solution for profiling the performance of your .NET applications.
Pricing: dotTrace 5.0 Performance Professional - Per-developer commercial License 1-9 Developer License - (price per license), dotTrace 5.0 Performance Professional - Per-developer commercial License 10-19 Developer License - (price per license), dotTrace 5.0 Performance Professional - Per-developer commercial License 20-49 Developer License - (price per license), dotTrace 5.0 Performance Professional - Floating commercial License 1-9 Floating License - (price per license), dotTrace 5.0 Performance Professional - Floating commercial License 10-19 Floating License - (price per license), dotTrace 5.0 Performance Professional - Floating commercial License 20-49 Floating License - (price per license), dotTrace 5.0 Performance Professional - Personal License 1-9 Personal License - (price per license), dotTrace 5.0 Performance Professional - Personal License 10-19 Personal License - (price per license), dotTrace 5.0 Performance Professional - Personal License 20-49 Personal License - (price per license), dotTrace 5.0 Performance Standard - Per-developer commercial License 1-9 Developer License - (price per license), dotTrace 5.0 Performance Standard - Per-developer commercial License 10-19 Developer License - (price per license), dotTrace 5.0 Performance Standard - Per-developer commercial License 20-49 Developer License - (price per license), dotTrace 5.0 Performance Standard - Floating commercial License 1-9 Floating License - (price per license), dotTrace 5.0 Performance Standard - Floating commercial License 10-19 Floating License - (price per license), dotTrace 5.0 Performance Standard - Floating commercial License 20-49 Floating License - (price per license), dotTrace 5.0 Performance Standard - Personal License 1-9 Personal License - (price per license), dotTrace 5.0 Performance Standard - Personal License 10-19 Personal License - (price per license), dotTrace 5.0 Performance Standard - Personal License 20-49 Personal License - (price per license)
Evals & Downloads: Read the dotTrace Data Sheet - Requires Acrobat Reader, View the dotTrace Profiling Benefits document - Requires Acrobat Reader, View the dotTrace Reviewer's Guide - Requires Acrobat Reader, View the dotTrace Default keymap - Requires Acrobat Reader, Read the dotTrace License Agreement, Download the dotTrace Performance 5.0 evaluation on to your computer - Expires After 10 Days
Operating System for Deployment: Windows 7, Windows XP, Windows Server 2003, Windows 2000
Architecture of Product: 32Bit
Product Type: Add-In, Application
Compatible Containers: Microsoft Visual Studio 2010, Microsoft Visual Studio 2008, Microsoft Visual Studio 2005, Microsoft Visual Basic 2010, Microsoft Visual Basic 2008, Microsoft Visual Basic 2005, Microsoft Visual C++ 2010, Microsoft Visual C++ 2008, Microsoft Visual C++ 2005, Microsoft Visual C# 2010, Microsoft Visual C# 2008, Microsoft Visual C# 2005, .NET Framework 4.0, .NET Framework 3.5, .NET Framework 3.0, .NET Framework 2.0, .NET Framework 1.1, .NET Framework 1.0, Silverlight 4
Keywords: dottrace, dot trace, memory leak detection, .net profiler, asp.net code profiler, dot net profiler, memory leak detector, memory profiler, c# profiler, dot trace, .net memory leak
jetbrains, jet brains, intellij, intellij idea, resharper, teamcity, team city, rubymine, ruby mine, youtrack, dottrace, dot trace, jetbrains idea, intellij download
Debugging debug debugs Testing Test Tests
Development
Part numbers: PC-517704-447308 517704-447308 PC-517704-447311 517704-447311 PC-517704-447314 517704-447314 PC-517704-447317 517704-447317 PC-517704-447320 517704-447320 PC-517704-447323 517704-447323 PC-517704-447326 517704-447326 PC-517704-447328 517704-447328 PC-517704-447330 517704-447330 PC-517704-447332 517704-447332 PC-517704-447334 517704-447334 PC-517704-447336 517704-447336 PC-517704-447338 517704-447338 PC-517704-447340 517704-447340 PC-517704-447342 517704-447342 PC-517704-447344 517704-447344 PC-517704-447346 517704-447346 PC-517704-447348 517704-447348
Publisher
Primary Category
Related Products
Related Categories