Query and reporting components implement the functionality to select, filter, view and present business data in a variety of readable formats. Typical applications include bill/invoice layout, mailing label creation and management reporting for business intelligence.
A premium .NET reporting solution for Web and desktop applications.
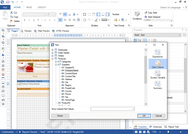
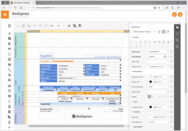
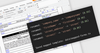
Visual Studio Designer - Create report layouts in Visual Studio and edit them either at design time, visually, through code, script, or regular expressions.
Includes over 600 UI Controls, DevExpress Dashboard, eXpressApp Framework and more.
Reporting & Analytics - Create high-performance decision support systems and analytics dashboards across platforms and devices with a fully integrated suite of UI controls, reporting tools and dashboards.
All Telerik .NET tools & Kendo UI JavaScript components in one package.
Powerful Report Management - Use Telerik Report Server as a standalone report management solution or integrate it easily with your application. Powered by Telerik Reporting.
Quickly build modern, high-performance apps for any platform.
ASP.NET Core Components - Cut development time and cost in half with more than 110 ASP.NET Core components for every need: navigation and layout, data management and visualization, editing, interactivity and more.
Royalty-free reporting tool and component library for .NET.
Blazor Report Viewer - Powered by the core reporting engine, the Blazor Report Viewer is based on the Blazor Server hosting model and allows you to display, print and export DevExpress Reports in your next Blazor Server app.
Build applications for Windows, Web, mobile and tablet.
WinUI Reporting - You can use integrated report and data source wizards, group and sort data, drag and drop report controls/fields onto the report design surface, localize reports, handle events and preview reports.
Interactive Preview - The preview offers a wealth of functions for interactive reporting with drilldown, expandable regions, animations, sorting and dynamic data filtering via report parameters.
Reporting for .NET 5, .NET Core, Blazor, ASP.NET and WinForms.
Visual Report Designer - Supports zooming, undo/redo, guidelines, rulers and more. The designer gives your users the ability to modify existing reports or create new ones and is run-time royalty-free.
JavaScript reporting solution for Web applications.
Report Designer - The ActiveReportsJS Designer intuitively extracts data and prepares it for visualization in the form of reports. It supports binding to JSON data sources, via Web services, or local JSON files. Multiple data sources can also be added in a single report.
Exporting - Stimulsoft Reports.JS allows you to export rendered reports to several different formats including: PDF, XPS, HTML, TXT, Microsoft Word, Microsoft Excel, CSV, XML, BMP, GIF, PNG, TIFF, JPEG and SVG.