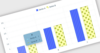
Data visualization components implement the functionality to view data in tables or data grids, as simple charts or complex graphs and enables you to create sophisticated management dashboards using gauges, maps and flowcharts.
Add interactive charts and maps to your apps and websites.
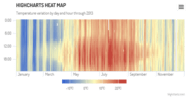
Responsive Stock Charts - Highcharts Stock's responsiveness goes beyond simply fitting the chart to the dimensions of its container. It also automatically finds an optimal placement for non-graph elements such as legends and headings.
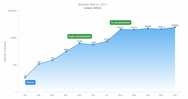
Advanced data visualization for more informative reports.
Nevron Map for SSRS - Provides report authors with an easy and powerful way to create choropleth and informative maps that are integrated with data. A perfect complement to any report that displays geographical data of any type.
A comprehensive, native Blazor UI components library.
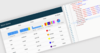
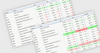
Fast & Powerful Grid Component - A feature-rich component useful for displaying data in a tabular format. Its wide range of functionalities include data binding, editing, Excel-like filtering, custom sorting, aggregating rows, selection and support for Excel, CSV and PDF formats.
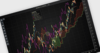
Create stock or general timeline charts for your Web and mobile apps.
Stock and Timeline Charts - Highcharts Stock provides a wide range of dynamic, responsive stock chart types and timelines which can be used to visualize the most complex data in an understandable, user-friendly format.
Build responsive, interactive JavaScript data grids and tables.
Conditional Formatting - Easily customize the look and feel of your grids and tables using conditional formatting to render content differently based on a value. You can perform row, column or cell formatting.
.
Data visualization components for desktop and Web applications.
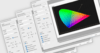
Nevron Gauge and Map for .NET - Suitable for any application that needs to visualize KPIs, scorecards or geographical data. The controls feature a full set of radial and linear gauges, LED displays, state indicators, and map projections.
JavaScript charts programming library for all your data visualization needs.
Threaded Rendering - Even with thousands of data points to crunch, the charts will not bring your browser to a crawl, thanks to the incremental data parsing/chart rendering system. While your chart is built, the whole page will remain responsive.
Code once in C# and XAML across native mobile devices.
FlexGrid - Display tabular data across columns and rows with this powerful grid control. FlexGrid for Xamarin brings a spreadsheet-like experience to your apps, with intuitive touch gestures and quick-cell editing capabilities.
All Telerik .NET tools & Kendo UI JavaScript components in one package.
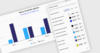
Rich Dashboards for WPF - The Executive Dashboard sample application demonstrates how you can use the WPF Gauge, Chart and ProgressBar controls to build a rich dashboard.