
Nevron Chart for SSRS
Advanced charting solution for Reporting Services.
Published by Nevron
Distributed by ComponentSource since 1999
Prices from: ₩ 2,543,700 Version: 2026.1 NEW Updated: Apr 29, 2026 ![]()
![]()
![]()
![]()
![]() (1)
(1)
Advanced charting solution for Reporting Services.
Published by Nevron
Distributed by ComponentSource since 1999
Prices from: ₩ 2,543,700 Version: 2026.1 NEW Updated: Apr 29, 2026 ![]()
![]()
![]()
![]()
![]() (1)
(1)

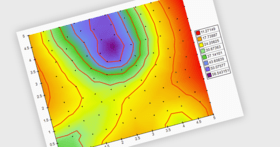
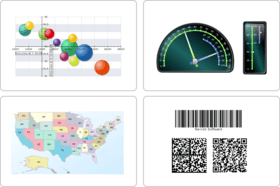
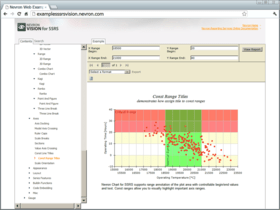
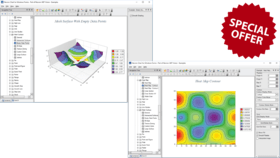
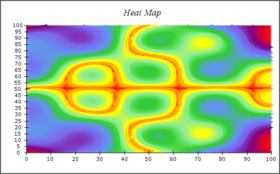
Nevron Chart for SQL Server Reporting Services (SSRS) is an advanced report item, which delivers a complete set of 2D and 3D charting types, highly customizable axes, tight data integration, visual effects and additional customization properties to your reports. Designed to enhance SQL Server Reporting Services, it also improves your report authoring experience, with its polished visual editors, refined settings and well-organized structure. Nevron Chart for SSRS is an indispensible tool for any serious Business Intelligence, Scorecard, Presentation, Scientific or general purpose report. The product introduces advanced Axis Features, numerous XY and XYZ scatters, Surface Charts, many customization properties, seamless integration with SQL Server Reporting Services, Photoshop-like effects, HTML-like rich-text formatting much more.


Image 1 / 6
Nevron Chart for SSRS features:
General Features

Nevron Chart for SSRS is also available in:
Live Chat with our Nevron licensing specialists now.


Tel: (888) 850 9911
Fax: +1 770 250 6199


