Kendo UI
Everything you need to build modern, beautiful, responsive apps.
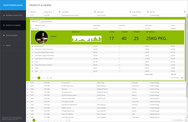
TreeList - The TreeList component is designed to display relational data. Features include sorting, filtering, paging, editing and virtualization. Each column can be easily resized or reordered and users can use templates to customize TreeList cells for a custom look and feel.