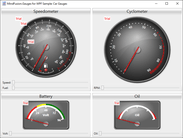
Data visualization components implement the functionality to view data in tables or data grids, as simple charts or complex graphs and enables you to create sophisticated management dashboards using gauges, maps and flowcharts.
Advanced data visualization for more informative reports.
Nevron Chart for SSRS - Delivers a complete set of 2D and 3D chart types, customizable axes, data integration and visual effects to your reports. An indispensable tool for any Business Intelligence, scorecard or scientific report.
Add interactive charts and maps to your apps and websites.
Map collection - Highcharts Maps includes a collection of maps, optimized for use with Highcharts Maps. For common maps, it saves you the trouble of finding or drawing suitable SVG or GeoJSON maps. Instead, you can choose between hundreds of pre-generated maps of countries, regions and other administration levels.
A pure JavaScript library for creating responsive, interactive charts for React apps.
Highcharts Gantt - Includes a robust JavaScript library that makes it easy for developers to build interactive charts for allocating, coordinating, and displaying tasks, events and resources along a timeline. It is customizable across a multitude of use-cases and across a multitude of platforms and clients.
Adaptive UI for building Windows 10 apps with one code base.
UWP ListView - The UWP ListView control offers two built-in layout types. Stack arranges items in a vertical / horizontal scrolling list. Wrap arranges items in a wrapped grid.
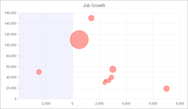
JavaScript charts programming library for all your data visualization needs.
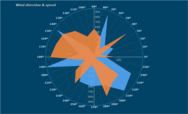
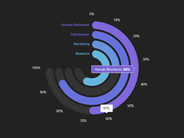
Everything’s Configurable - Numerous configuration options allow inventive uses, bordering on new chart types. Angles, colors, positions, radii, anything can be set to bend classic and new chart types exactly the way you need them.
High-performance toolkits for your development projects.
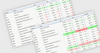
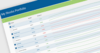
Powerful Data Grid - Data-bind to any data source, format data with a rich selection of cell types, and enable editing, sorting, filtering and grouping within a few minutes. Export to Excel and PDF formats.
Data visualization components for desktop and Web applications.
Nevron Chart for .NET - Display virtually any 2D, 3D chart or gauge with superior quality. Packed with hundreds of intuitive examples and many advanced features, Nevron Chart allows you to get started quickly using no code at all.
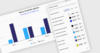
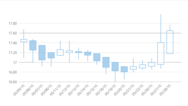
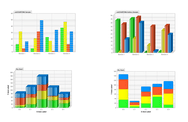
Interactive Charts & Graphs - Visualize and analyze data with 30+ charts and graphs ranging from line to financial charts. Users can interact and explore with features such as zoom and pan, selection, tooltip and trackball.
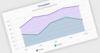
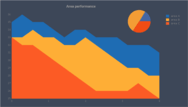
Create animated and interactive charts with thousands of data records.
JavaScript API - The robust API allows you to leverage and interact with your charts autonomously and also allows for full extension of chart types and design. Easily add interactions with just a few lines of code.