Data visualization components implement the functionality to view data in tables or data grids, as simple charts or complex graphs and enables you to create sophisticated management dashboards using gauges, maps and flowcharts.
Advanced data visualization for more informative reports.
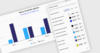
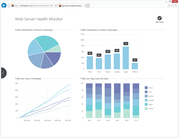
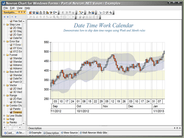
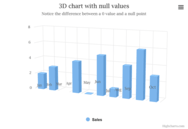
Nevron Chart for SSRS - Delivers a complete set of 2D and 3D chart types, customizable axes, data integration and visual effects to your reports. An indispensable tool for any Business Intelligence, scorecard or scientific report.
Add interactive charts and maps to your apps and websites.
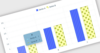
Responsive Stock Charts - Highcharts Stock's responsiveness goes beyond simply fitting the chart to the dimensions of its container. It also automatically finds an optimal placement for non-graph elements such as legends and headings.
Connectivity and Exporting - TeeChart JS allows you to easily connect your charts to an existing database or dataset using JSON or XML. Charts can also be exported to PNG or JPEG images as required.
Build rich, cross-platform responsive web and cloud apps.
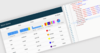
ASP.NET MVC Grid - The Telerik Grid for ASP.NET MVC lets you perform operations such as paging, sorting, filtering, grouping, editing, exporting and many more.
Create simple, flexible and highly customizable organization charts.
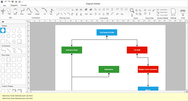
Organization Charts - OrgChart JS is a powerful component that allows you to visualize nodes. It provides a variety of ways to manipulate the underlying data including node editing, navigation, expand/collapse, drag & drop and grouping.
JavaScript charts designed to be embedded and integrated.
Your Charts, Your Design - It is easy to adjust the look and feel of your charts using themes and palettes - AnyChart includes pre-built sets or you can create your own scheme.
Build applications for Windows, Web, mobile and tablet.
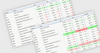
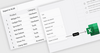
WinExplorer HTML Templates - HTML-CSS templates allow you to override the default data presentation in all view styles. Use HTML markup to specify content for WinExplorer View items and use CSS code to customize the appearance, size, padding and layout of UI elements.
Add financial, scientific, engineering and business charts to your applications.
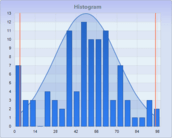
Graph Annotations - Annotations allow for mixing text and symbols in a tabular fashion within the chart or boundary of a chart. Table annotations can contain header columns and rows, hot spots, and real-time updating.
Deliver amazing user experiences on the WinForms platform.
WinForms Spreadsheet Control - An Excel inspired control that allows you to add spreadsheet functionality to any WinForms application. It can load, convert and save workbooks to XLS format and can export and import XLSX, CSV and TXT files.