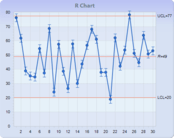
Data visualization components implement the functionality to view data in tables or data grids, as simple charts or complex graphs and enables you to create sophisticated management dashboards using gauges, maps and flowcharts.
Advanced data visualization for more informative reports.
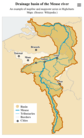
Nevron Map for SSRS - Provides report authors with an easy and powerful way to create choropleth and informative maps that are integrated with data. A perfect complement to any report that displays geographical data of any type.
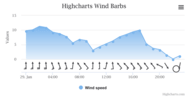
Add interactive charts and maps to your apps and websites.
Map collection - Highcharts Maps includes a collection of maps, optimized for use with Highcharts Maps. For common maps, it saves you the trouble of finding or drawing suitable SVG or GeoJSON maps. Instead, you can choose between hundreds of pre-generated maps of countries, regions and other administration levels.
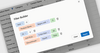
A comprehensive, native Blazor UI components library.
Fast & Powerful Grid Component - A feature-rich component useful for displaying data in a tabular format. Its wide range of functionalities include data binding, editing, Excel-like filtering, custom sorting, aggregating rows, selection and support for Excel, CSV and PDF formats.
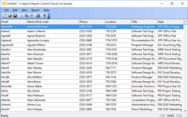
Provides Visual C++ MFC developers with a professional set of modern controls.
Codejock Report Control - Easily create, group and sort data in a flat or hierarchical format. Options include integrated field chooser, virtual list mode, reusable layouts, multiple selection, tree view mode and more.
Easily Generate Rich Charts - Actipro Charts supports many chart types from basic line and bar charts to complex stacked area charts. It includes useful features such as multiple series, labels, legends, stacking, and customizable palettes.
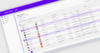
JavaScript component suite for responsive Web development.
JavaScript Charting - A collection of 30+ responsive chart types including area, bar, financial, funnel, line, pie, polar, pyramid and range that support binding to any data source. You can easily combine different series types and display them across different panes within the same display.
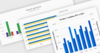
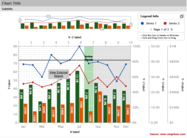
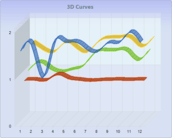
Create animated and interactive charts with thousands of data records.
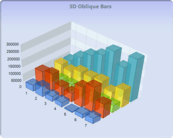
Chart Types - Choose from over 35 built-in chart types and modules including: area, bar, 100% stacked, boxplot, bubble, bullet, gauge, heatmap, pie radar and more. You can also easily add additional charts to the same page.
Sleek UI and tools for .NET and JavaScript technologies.
120+ WinForms UI Controls - Telerik DevCraft UI includes a wide array of WinForms contols including data management, data visualization, interactivity, document processing, editors, layout and navigation.
All Telerik .NET tools & Kendo UI JavaScript components in one package.
Easily build modern Web Apps - Kendo UI delivers everything you need to build a modern Web application under tight deadlines, with out-of-the-box features and functions that can speed your development time by 50 percent.