


Fournisseur officiel
Comme nous somme les distributeurs officiels et autorisés, nous vous fournissons des licences légitimes directement à partir de 200+ éditeurs de logiciels.
Voyez toutes nos marques.
Continuer de lire en anglais:
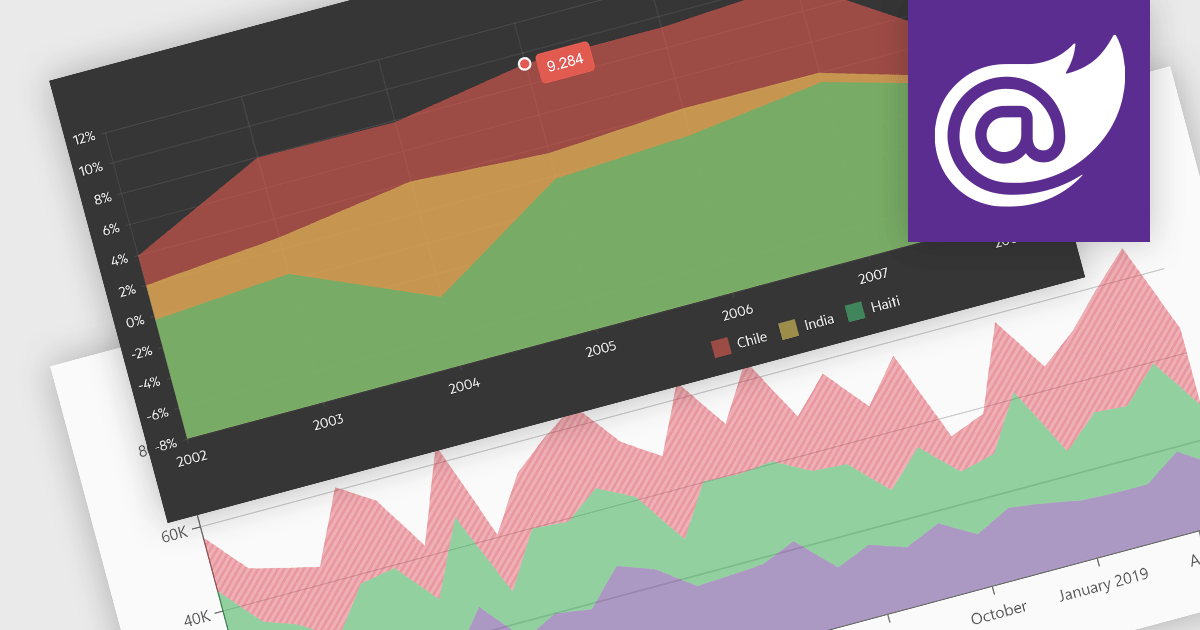
Area charts combine the strengths of line and bar charts, typically depicting how quantitative data changes over time. The area beneath the lines is shaded, emphasizing trends, comparisons between multiple data series, and the magnitude of change within each series. Ideal for showcasing cumulative totals and proportions, area charts excel in revealing trends and relationships within your data.
Several Blazor chart controls offer area charts including:
For an in-depth analysis of features and price, visit our Blazor chart controls comparison.


Tél : (888) 850 9911
Fax : +1 770 250 6199


