공식 공급 업체
200 이상의 소프트웨어 개발처와 판매 계약을 맺은 공인 디스트리뷰터로서 합법적인 라이선스를 제공합니다.
모든 브랜드 보기.
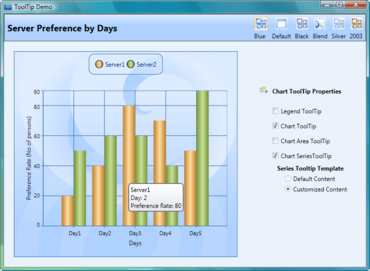
Syncfusion Essential Chart is a business-oriented charting component which offers an innovative data object model that makes it easy to populate a chart with any kind of data source. Syncfusion Essential Chart features an advanced styles architecture that simplifies complex multilevel formatting. It can handle data in different ways. You can add data points to a series and let the chart manage them. Alternatively, you can achieve easier data binding to a data set using the built-in ChartDataBindModel control, and you can specify column names containing the x- and y-coordinate values. For additional flexibility, you can implement the IChartSeriesModel interface and plug-in a custom model. Syncfusion Essential Chart includes components for Windows Forms, ASP.NET, ASP.NET MVC, Silverlight and WPF platforms.
The following editions are available:
Essential Chart for ASP.NET MVC Mobile
Essential Chart for ASP.NET
Essential Chart for ASP.NET MVC
Essential Chart for WPF
Essential Chart for Windows Forms
Founded by industry experts in 2001, Syncfusion provides the broadest range of enterprise-class software components and tools for the Microsoft .NET platform. With Syncfusion, developers can move beyond simply coding applications to delivering real business innovation -- the elegant user interfaces, business intelligence dashboards, and sophisticated reporting that today's business users need, in the formats they demand. Their award-winning .NET components and controls are designed to meet your evolving development needs, whether you're working in Windows Forms, WPF, ASP.NET, ASP.NET MVC, or Silverlight. Syncfusion uncompromisingly strive for excellence in order to offer the very best value to our customers - from small ISVs to Fortune 100 companies.

Add rich, interactive financial and business charts to your ASP.NET applications.
Syncfusion 사 제품 라이선스 담당자와 라이브 채팅