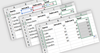
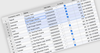
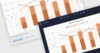
Pivot Table - 데이터를 구성 및 요약하고 결과를 크로스-테이블 형식으로 표시합니다. 데이터 바인딩, 드릴업 및 드릴다운, Excel과 유사한 필터링, 정렬, 편집, Excel 및 PDF 내보내기, 기본 제공 집계, 피벗 테이블 필드 목록 및 계산된 필드가 포함됩니다.
600개 이상의 UI 컨트롤, DevExpress Dashboard, eXpressApp Framework 등을 포함합니다.
계층적 레포트 (Hierarchical Reports) - 계층적 레포트는 DetailBand.DrillDownControl 속성을 사용하여 기본 제공 Drill-Down 지원을 제공하며, Print Preview에서 이 속성에 할당된 컨트롤을 클릭하면 해당 데이터 수준이 확장 또는 축소 됩니다.
JavaScript Charting - 모든 데이터 소스에 대한 바인딩을 지원하는 선형 차트, 영역 차트, 막대 차트, 원형 차트, 깔때기형 차트, 피라미드 차트, 재무 차트, 범위 차트 및 극좌표 막대 차트 등 반응 속도가 빠른 30개 이상의 차트가 포함된 차트 유형 모음입니다. 서로 다른 시리즈 유형을 손쉽게 결합하여 동일한 디스플레이 내의 다른 창에 표시할 수 있습니다.
Create interactive, touch-driven reports and dashboards for Web and mobile apps.
Big Charts with Little Code - Simply integrate a few lines of code in your website to implement the charts of your choice. Don't worry about data coming from different sources - you can mix multiple data sources in the same chart if necessary.
Stunning JavaScript charts for your website or Web application.
Chart Types for Every Need - Comes with an impressive array of chart types that provide beautifully rendered visuals. It also includes real-time charts that users can interact with, and extensive small chart support optimized for thousands of charts per page.