Fournisseur officiel
Comme nous somme les distributeurs officiels et autorisés, nous vous fournissons des licences légitimes directement à partir de 200+ éditeurs de logiciels.
Voyez toutes nos marques.
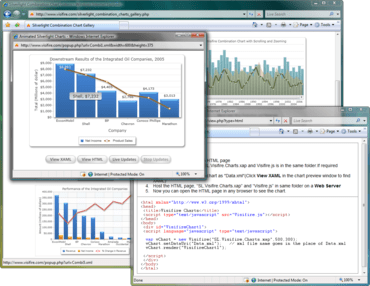
Visifire lets you add charts and gauges in your Silverlight, WPF, Windows Phone & SharePoint applications. It supports a wide range of chart and gauges including column, line, doughnut, radar, pie and candlestick. The Silverlight controls can also be embedded in any Web page as a standalone Silverlight App. Visifire is independent of server side technology and can be used with ASP, ASP.NET, SharePoint, PHP, JSP, ColdFusion, Python, Ruby or just simple HTML.
Webyog creates innovative data management tools for thousands of customers across many countries, ranging from enterprises to small businesses and home users. The company provides data management tools for managing popular open-source databases. Webyog consistently receive top ratings and recommendations by respected third-party media and product reviewers. More than 2 million users worldwide have selected Webyog to help them smartly manage, monitor and optimize their databases.

Discutez en direct avec l'un de nos spécialiste des licences Webyog .