Create Interactive Reports with SVG Charts
June 9, 2026Product Update
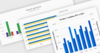
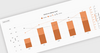
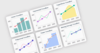
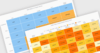
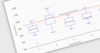
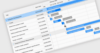
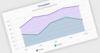
Blazorise V2.2 adds a native C# and Blazor charting engine that makes it easier to build rich data visualizations and dashboards.
Tel: (888) 850 9911
Fax: +1 770 250 6199