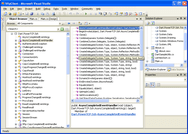
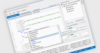
Software components and controls are pre-built software libraries that you can use in your application to add new functionality. By adding functionality written by experts, you are not only saving time and effort but also adding high quality features to your application - fast.
Reporting for .NET 5, .NET Core, Blazor, ASP.NET and WinForms.
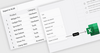
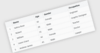
Report Elements - A wide range of band types allow you to create any kind of report: list, master-detail, group, multi-column, master-detail-detail and many more.
Includes over 600 UI Controls, DevExpress Dashboard, eXpressApp Framework and more.
DevExpress Reports - A feature-complete reporting platform which ships with an easy-to-use Visual Studio report designer and a rich set of report controls, including pivot tables and charts so you can construct reports of unmatched elegance and informational clarity.
JavaScript reporting solution for Web applications.
Cross-Platform Tools - Build interactive, customizable reports with a cross-platform standalone designer application. It can be installed on Windows, Mac or Desktop Linux and includes a rich set of data visualization components.
Diagramming components for dependency visualization and analysis.
Auto Sorting - By default the component distributes all nodes in the diagram into distinct levels. This gives the end user a clear indication of relationships in the diagram. For any given node, all nodes that are below it, are either its dependents or minors.
A premium .NET reporting solution for Web and desktop applications.
Blazor Viewer - Integrate a full-featured, customizable report viewer into your Blazor applications. It can automatically adjust to your screen size giving the best view of your reports on modern browsers, mobile and desktop devices.
Open, create, convert, print and save files from within your own applications.
Aspose.Slides for .NET - Enables any .NET application to read, write, modify and convert PowerPoint documents, without the need for Microsoft PowerPoint. It can render presentation slides to PDF, XPS, HTML, images and PDF Notes.
Comprehensive API - Leverage the extensive JavaScript spreadsheet library API and powerful calculation engine to create analysis, dashboard, data collection and financial applications.
JavaScript component suite for responsive Web development.
Grid Toolbar Customization - A new toolbar property allows you to customize toolbar items in much the same way as a standalone Toolbar. In addition, you can specify an item using a predefined string name from the list of built-in DataGrid commands.
Build responsive, interactive JavaScript data grids and tables.
Sorting - You can sort specific columns and even provide your own custom sort function to order data. Clicking on a column header will sort that column, first click sorts by ascending order, second by descending, and third removes the sorting and resets to the natural order.