
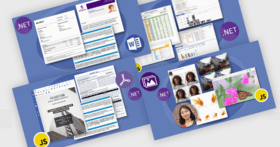
ActiveReports Reporting/BI Suite for .NET
Complete Reporting and Business Intelligence (BI) tools for Visual Studio.NET.
MESCIUS (formerly GrapeCity)사에서 공개
1996년 부터 ComponentSource에서 판매중
더 이상 이 제품을 제공 하지 않습니다.
Complete Reporting and Business Intelligence (BI) tools for Visual Studio.NET.
MESCIUS (formerly GrapeCity)사에서 공개
1996년 부터 ComponentSource에서 판매중

On July 1, 2012, ComponentOne and GrapeCity joined forces, creating ComponentOne, a division of GrapeCity.
The US GrapeCity PowerTools division was renamed to ComponentOne.
ActiveReports Reporting/BI Suite for .NET is no longer sold. However, some of the individual products from within the suite are still available, see ActiveReports.
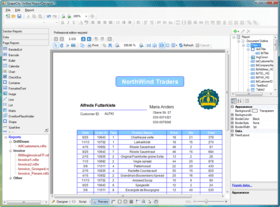
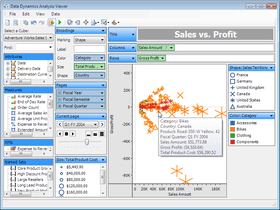
ActiveReports Reporting/BI Suite for .NET premium value pack includes: ActiveReports 6 Professional, ActiveAnalysis and Data Dynamics Reports.

MESCIUS (formerly GrapeCity) 사 제품 라이선스 담당자와 라이브 채팅


전화 : 00798 14 800 6332
팩스 : +1 770 250 6199


