
AnyMap JS
Build interactive JavaScript maps with data related to geographic area.
Published by AnyChart
Distributed by ComponentSource since 2017
Prices from: ₩ 209,300 Version: 8.14.0 Updated: Nov 19, 2025
Build interactive JavaScript maps with data related to geographic area.
Published by AnyChart
Distributed by ComponentSource since 2017
Prices from: ₩ 209,300 Version: 8.14.0 Updated: Nov 19, 2025

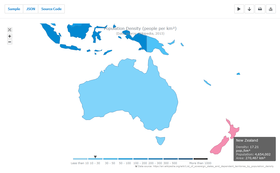
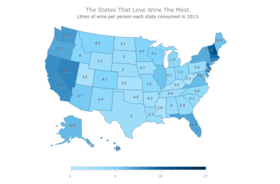
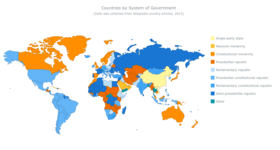
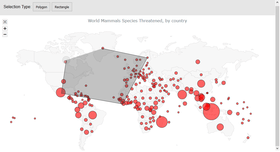
AnyMap JS helps you build interactive maps and display them in any browser on any platform. AnyMap JS is useful when you need to display sales by region, election results, population density or any other information related to geographic area. The maps are compatible with other AnyChart products and can be used as part of a dashboard. AnyMap JS comes with a Maps Collection that includes 100’s of ready to use maps.


Image 1 / 7
AnyMap JS Features


Live Chat with our AnyChart licensing specialists now.


Tel: (888) 850 9911
Fax: +1 770 250 6199


