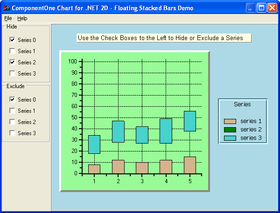
ComponentOne Chart for WinForms includes a 2D and a 3D chart control for use in your Windows applications. Use the 2D Chart to display data as a bar, X-Y plot, area, pie, radar, polar, candle, or combination chart. ComponentOne Chart for WinForms 2DChart control is optimized for real-time applications giving you the ability to display rapidly changing data. Use the 3D Chart to create 3D surface, contour, or bar charts that end-users can easily rotate, scale, or zoom interactively. ComponentOne Chart for WinForms 3DChart can display 3D data in 15 basic surface or bar appearances and automatically generate contours and zones from the data. ComponentOne Chart for WinForms is Visual Studio 2010 compatible.