Screenshot Preview

ComponentOne WebChart for ASP.NET

by ComponentOne - 상품타입: Component / ASP.NET WebForms / 100% Managed Code

 *

ComponentOne WebChart for ASP.NET is now officially part of ComponentOne Studio Enterprise and ComponentOne Studio for ASP.NET.

If you require 5 or more individual licenses for ComponentOne WebChart for ASP.NET, please Contact Us for pricing and availability.

주의 : 별도의 안내가 없는 경우에는 영어제품 입니다.

*

Render an image of a chart and create fully functional charts with client interaction in ASP.NET Web applications. 
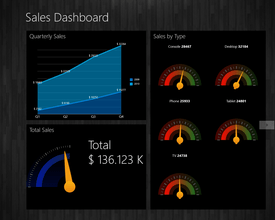
ComponentOne WebChart for ASP.NET can use a variety of chart types to display complex sets of data and create user-friendly charting applications. ComponentOne WebChart for ASP.NET supports many different 2D chart types, including: bubble, line and area, bar, stacking bar, pie, candle, HiLo, HiLoOpenClose, polar, and radar charts. ComponentOne WebChart for ASP.NET supports many different 3D chart types, including: scatter, bar, and surface charts. The C1WebChart control allows the handling of events and interaction (tooltips and hyperlinks) in the client’s browser through the use of an HTML ImageMaps. Compatible with Visual Studio 2003, Visual Studio 2005 and Visual Studio 2008 (VS2005, VS2008)

 *

ComponentOne WebChart for ASP.NET is part of the ComponentOne Studio Enterprise and the ComponentOne Studio for ASP.NET

ComponentOne WebChart includes the features of ComponentOne Chart for .NET:

  • Easy to use - A point-and-click user interface is available both during development, and at run time. Both developers and end-users have maximum flexibility to easily customize charts
  • Chart types - Area, bar, bubble, candlestick, hi-low-open-close, pie, plot, polar, radar, ribbon, scatter, stacking area, stacking bar, surface, and more. From scientific information to stock market data, there's a chart for every need
  • Unicode - ComponentOne have included 2D and 3D Unicode controls to allow multiple language support in a single applicationAlarm zones
  • You can now use background bands of color or pattern to demarcate significant Y values in charts
  • Flexible labels - Chart labels and annotations can be positioned anywhere. Multi-line chart labels are unlimited and can be attached to data displayed in the graph or to graph or pixel coordinates
  • Tunable auto-precision axis - The axis precision is automatically adjusted to fit the data
  • Code-free data binding - Bind your chart to an external data source to chart data directly in its native format
  • Web-friendly output - ComponentOne Chart for .NET can be saved in JPEG or PNG format for easy display on web pages
  • Background images - Customize the look of your chart. You can display any image in the chart background to give your chart a custom look and feel
  • Mouse tracking - Mouse tracking capabilities keep track of the region, series, or data point under the mouse pointer. The MouseMove event of .NET reports the coordinates of the user's cursor as they drag it over the chart. From this event you can get constantly updating data on where the user's cursor is located. ComponentOne Chart for .NET contains a set of methods that when used in conjunction with. NETs MouseMove event allow the programmer to create interesting application-specific features like handling a double-click in the legend, or chart tool tips
  • Double buffering - Double buffering makes use of an off-screen memory area to help reduce flicker when doing screen updates
  • Copying data - Instead of copying data to the chart point-by-point, ComponentOne Chart allows you to copy entire arrays, which means an increase in performance
  • Multiple format image generation

A Sampling of 2D Features

  • Multiple symbol types - Choose from various symbol types to represent different series of data
  • Chart types - X-Y Plot, Area, Bar, High-Low, High-Low-Open-Close, Candle, Bubble, Pie, Radar, and Polar charts provide various ways to display data
  • Stacking charts - X-Y Plot, Area, Bar, Radar, and Plot charts can be stacked to display more complex data in a smaller space
  • Interactive wizard - The Chart2D Wizard was designed to allow an easy and interactive way to create and modify chart properties. It displays the chart properties step by step, permitting the construction or modification of a chart in a progressive and logical manner
  • Legend - Take complete control over the legend appearance. The order of entries in the legend can be reversed, and single-line legend titles can be added
  • Annotations - Annotations can be rotated to arbitrary angles
  • CopyDataIn - The CopyDataIn method accepts the DATE parameter type

A Sampling of 3D Features

  • Built-in zooming, scaling and rotation - Users can dynamically customize views by dragging the mouse on the graph. Users can view a preview cube or the entire graph during rotation, scaling or zooming
  • Various 3D chart types - Chart types include Surface, bar, and scatter charts that provide various ways to effectively display your data
  • Automatically generate contours and zones from data - To generate contours and zones, the ComponentOne Chart for .NET analyzes the data and based on the number of levels specified, creates the following: A linear distribution table that contains the Z-value that marks each level, An assignment of ContourStyles from the 100 built-in styles, The chart determines which styles to use by evenly distributing its 100 styles through the number of levels
  • Interactive viewing - This feature allows both the programmer and the end user (at run-time) to utilize chart rotation, shift and zoom. Using keyboard/mouse combinations, you can perform different interactions. These interactions can be customized (from the default settings) by the programmer to give their end users the ability to interact with the chart area
  • Transparent data plotting - Use the Chart3DElevation Transparency property to set transparency. Your data will appear transparent, leaving the chart area behind the chart data visible
  • 4D charts capability - By setting the 4D Data Menu item, the chart is able to show a 4D chart, which means that different data is used for plotting and contouring
  • Interactive wizard - The Chart3D Wizard was designed to allow an easy and interactive way to create and modify chart properties. It displays the chart properties step by step, permitting the construction or modification of a chart in a progressive and logical manner
  • Legend - You can use custom levels, filtered, or single-line legend titles
  • Enhanced grid line display - Grid lines can be assigned to line styles, including individual colors
  • Flexible data layout - Regular or irregular data structures can be selected
  • Borders - Select from an array of border styles including solid, raised, raised 3d, 3d inset, 3draised bevel, 3d inset bevel, groove (inset + Raised), fillet (raised + inset), double, and dashed

지원

 *

ComponentOne Platinum Support Subscriptions provide a full year of Telephone and Online Technical Support. ComponentOne Technical Support Engineers are available by phone Monday through Friday, except U.S. holidays, from 9:00 a.m. to 5:00 p.m. Eastern,USA. Customers outside the USA, please remember to check your time difference for phone support.

주의

제품 리뷰의 한국어 번역이 완료되지 않는 제품은 Google통역 서비스와 연동되어 표시되어 있습니다.통역 기계에 의한 자동 번역인 관계로 한국어 표기가 조금 부자연 스러운 점 양해 바랍니다.
에서 제공
FireFox와 Opera에서는 Flash가 필요합니다.

상품검색

검색어를 입력해주세요:

ComponentSource에서 구입하는 이유?

ComponentSource는 세계 1,000,000명 이상의 개발자에게 각종 글로벌 서비스를 제공합니다.

상세 | About Us

화면 바로가기 갤러리

클릭해서 이미지를 확대

 ComponentOne WebChart for ASP.NET - .NET Component - 2009 v1의 스크린샷  ComponentOne WebChart for ASP.NET - .NET Component - 2009 v1의 스크린샷  ComponentOne WebChart for ASP.NET - .NET Component - 2009 v1의 스크린샷  ComponentOne WebChart for ASP.NET - .NET Component - 2009 v1의 스크린샷
Award Award