
ActiveAnalysis
Provide an interactive decision support system that allows users to explore their relational and multidimensional data in an useful way.
Publié par MESCIUS (formerly GrapeCity)
Distribué par ComponentSource depuis 1996
Nous ne fournissons plus ce produit.
Provide an interactive decision support system that allows users to explore their relational and multidimensional data in an useful way.
Publié par MESCIUS (formerly GrapeCity)
Distribué par ComponentSource depuis 1996

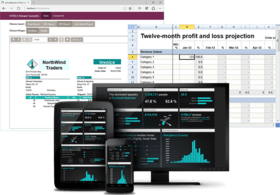
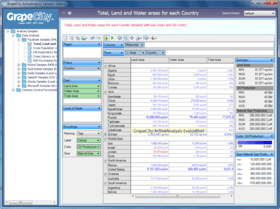
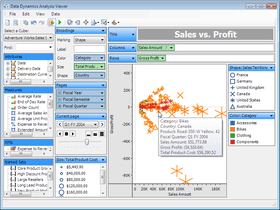
ActiveAnalysis (formerly Data Dynamics Analysis) is a complete OLAP, data visualization and Business Intelligence component for Silverlight, Windows Forms and ASP.NET that allows you to rapidly embed interactive, ad hoc Business Intelligence features for both Windows and Web applications. ActiveAnalysis comes with the ability to connect to virtually any data source and support for three development platforms, rolling out your own ad hoc Business Intelligence application is now easier than ever. ActiveAnalysis features include: charts, pivot tables and data visualization, rich drag-and-drop user experience, Excel exports allow end users to share analysis results offline and much more.


Image 1/6
ActiveAnalysis - Features and Benefits


Discutez en direct avec l'un de nos spécialiste des licences MESCIUS (formerly GrapeCity) .


I happened to download ActiveAnalysis from the grapecity web site and just discovered Componentsource.com. Very pleasantly surprised by the promise this components holds for developing OLAP and data... Lire la suite
Tél : (888) 850 9911
Fax : +1 770 250 6199


