
Infragistics NetAdvantage for Silverlight
Achieve rich, advanced data visualization that leverages the sophisticated capabilities of Silverlight.
Published by Infragistics
Distributed by ComponentSource since 1996
We do not supply this product anymore.
Achieve rich, advanced data visualization that leverages the sophisticated capabilities of Silverlight.
Published by Infragistics
Distributed by ComponentSource since 1996

New licenses of Infragistics NetAdvantage for Silverlight Data Visualization are no longer available. However, if you are an existing customer with a valid subscription you will be automatically upgraded to an Infragistics Professional subscription by the publisher.
If you have any queries please contact us.
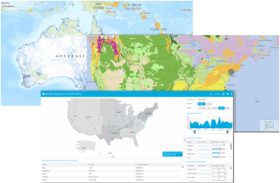
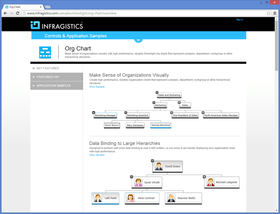
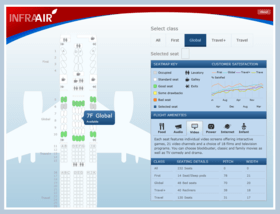
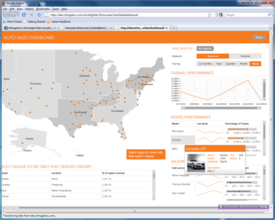
Infragistics NetAdvantage for Silverlight lets you create stylable user interface controls for geospatial mapping, interactive gauges, graphical timelines and animated charting. With Infragistics NetAdvantage for Silverlight you can build rich dashboards, visualize business data and empower decision-makers with a toolset for simplifying the presentation of your business intelligence.


Image 1 / 10
Koen Zwikstra, First Floor Software
NetAdvantage for Silverlight is a comprehensive collection of user interface controls to build rich dashboards, visualize business data and empower decision makers. Developers can quickly create high-end BI applications without writing a lot of code. You can present data clearly and cleanly. NetAdvantage for Silverlight gives developers controls that simplify the visual representation of large quantities of information in non-schematic ways.
NetAdvantage for Silverlight includes the...


Live Chat with our Infragistics licensing specialists now.


Awesome tools, these guys really make it easy to develop beautiful forms.
Tel: (888) 850 9911
Fax: +1 770 250 6199


