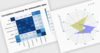
Data visualization components implement the functionality to view data in tables or data grids, as simple charts or complex graphs and enables you to create sophisticated management dashboards using gauges, maps and flowcharts.
Advanced data visualization for more informative reports.
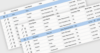
Nevron Chart for SSRS - Delivers a complete set of 2D and 3D chart types, customizable axes, data integration and visual effects to your reports. An indispensable tool for any Business Intelligence, scorecard or scientific report.
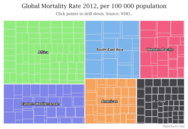
Add interactive charts and maps to your apps and websites.
Map collection - Highcharts Maps includes a collection of maps, optimized for use with Highcharts Maps. For common maps, it saves you the trouble of finding or drawing suitable SVG or GeoJSON maps. Instead, you can choose between hundreds of pre-generated maps of countries, regions and other administration levels.
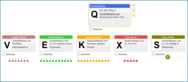
Everything you need to build modern, beautiful, responsive apps.
Modern UI Components - Kendo UI's 100+ components handle everything you need to satisfy your business requirements. Add advanced components such as data grids, charts, schedulers, and calendars with just a few lines of code.
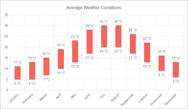
Create interactive JavaScript charts for Web, Mobile & Enterprise applications.
Works Everywhere - All charts work seamlessly across PCs, Macs, iPhones, iPads, and Android devices. All the charts are responsive to deliver the same experience everywhere.
JavaScript charts designed to be embedded and integrated.
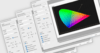
Your Charts, Your Design - It is easy to adjust the look and feel of your charts using themes and palettes - AnyChart includes pre-built sets or you can create your own scheme.
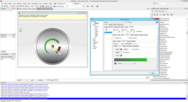
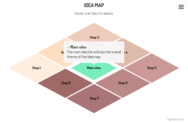
Create simple, flexible and highly customizable organization charts.
Exporting - OrgChart JS supports the following export formats; PDF, PNG, SVG and CSV. You can easily export an individual node with its children or an entire organization chart.
.
High-performance toolkits for your development projects.
MAUI Controls - A comprehensive collection of .NET MAUI components for building modern mobile and desktop applications with C# and XAML. It includes charts, gauge, tab view and document processing libraries (Excel, PDF, Word, and PowerPoint).
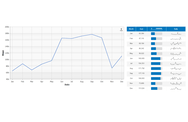
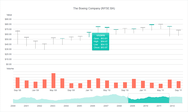
A comprehensive JavaScript charting library, with 40+ chart types.
Interactive Zooming/Scrolling - Display tens of thousands of data points like stock quote comparison for a decade with a neatly-compressed macroscopic view. The user can easily and intuitively zoom into any subset of data.
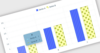
A pure JavaScript library for creating responsive, interactive charts for React apps.
Responsive Across Devices - Default responsiveness goes beyond fitting the chart to the dimensions of its container, but automatically finds an optimal placement for non-graph elements such as legends and headings.