by Nevron - Product Type: Add-In / ASP.NET AJAX (ATLAS) / .NET Class
Nevron Chart for SharePoint by Nevron
Deliver advanced charting solutions to the SharePoint environment. 
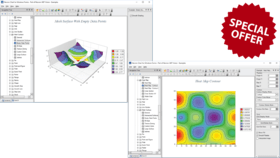
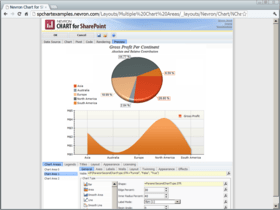
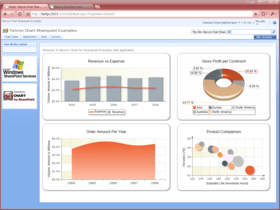
Nevron Chart for SharePoint is an advanced chart web part, which delivers a complete set of 2D and 3D charting types, highly customizable axes, advanced data analysis features, tight data integration and visual effects to your SharePoint sites. It combines the Nevron Charting engine for ASP.NET together with the elegant Nevron Pivot Data Aggregation engine. This allows Nevron Chart for SharePoint users to create complex pivot charts visually and directly in the SharePoint environment.
Nevron Chart for SharePoint General Features
Support for SharePoint Server 2007 - Nevron Chart for SharePoint introduces a new level of data visualization, designed to enhance your digital dashboards and reports in SharePoint enviroment.
Support for Multiple Charting Areas - Nevron Chart for SharePoint has support for unlimited number of charting areas. Each charting area has its own charting type and can be rendered in 2D or 3D mode. Charting areas can be automatically or manually arranged.
Support for Multiple Legends - Nevron Chart for SharePoint has support for unlimited number of legends. Each values data grouping can be assigned to a different legend. Legends can be manually positioned or docked to chart, chart areas and plot areas.
Support for Multiple Titles - Nevron Chart for SharePoint has support for unlimited number of titles. Titles can be manually positioned or docked to chart, chart areas and plot areas.
Support for Binding to Diverse Data Sources - Nevron Chart for SharePoint can bind to any ODBC, OLEDB or SQLServer data source and to the SharePoint specific Business Data Catalog.
Pivot Data Aggregation - Nevron Chart for SharePoint supports advanced pivot data aggregation features. You can use formula expressions to group, filter and sort the data. Data groupings are created for chart categories, series and values via client-side drag and drop. Numerous functions for different mathematical, statistical, date-time, logical and text operations ensure that the pivot aggregation is flexible enough to meet even the most complex data analysis scenarios.
Fast Web Based Chart Designer - Nevron Chart for SharePoint features an advanced chart designer, which is built with jQuery UI. The chart designer is fully ajaxified and supports all major web browsers. It does not use postbacks, MS ASP.NET controls or MS AJAX, which ensures that the server-client communication is brought to a minimum, the client-side is pure HTML/CSS with jQuery and the server-side UI processing is pure HTML and script rendering.
Nevron Chart for SharePoint Charting Types
Bar Charts (Horizontal and Vertical) - available in 2D and 3D - A Bar Chart displays a sequence of horizontal or vertical bars (shapes) of lengths proportional to the value that they represent. Bar charts are usually used for comparing two or more values or representing the contribution of each value to a total (stacks).
Horizontal and Vertical Bar Chart Subtypes: Clustered, Stacked, Stacked Percent, Series, XY Scatter, XY Scatter Clustered, XY Scatter Stacked, XY Scatter Stacked Percent, XYZ Scatter, XYZ Scatter Clustered, XYZ Scatter Stacked, XYZ Scatter Stacked Percent
Bar Chart Shapes: - Bar, Cylinder, Cone, Inverted Cone, Pyramid, Inverted Pyramid, Ellipsoid, Smooth Edge Bar, Cut Edge Bar
Area Charts - available in 2D and 3D - Area Charts display a sequence of filled areas between the axis (or an origin line) and the value line. Area charts are usually used for comparing two or more values or representing the contribution of each value to a total (stacks), usually over time or other X measurement.
Area Chart Subtypes: - Series, Stacked, Stacked Percent, XY Scatter, XY Scatter Stacked, XY Scatter Stacked Percent
Smooth Area Charts - available in 2D and 3D - Smooth Area charts are similar to Standard Area charts, the difference being that the successive data points are connected with cubic spline segments instead of straight lines.
Smooth Area Chart Subtypes: - Series, XY Scatter
Line Charts - available in 2D and 3D - A Line Chart displays a sequence of line segments that are sequencially connected. Line charts are usually used to show a trend or how a value contributes to a trend total (stacks), usually over time or other X measurement.
Line Chart Subtypes: - Series, Stacked, Stacked Percent, XY Scatter, XY Scatter Stacked, XY Scatter Stacked Percent, XYZ Scatter, XYZ Scatter Stacked, XYZ Scatter Stacked Percent
Line Chart Shapes: - Line, Tape, Tube, Ellipsoid
Smooth Line Charts - available in 2D and 3D - Smooth Line charts are similar to Line charts, the difference being that the successive data points are connected with cubic spline segments instead of straight lines.
Smooth Line Chart Subtypes: - Series, XY Scatter
Step Line Charts - available in 2D and 3D - Step Line charts are similar to Line charts, the difference being that the successive data points are connected with horizontal and vertical segments instead of straight lines.
Step Line Chart Subtypes: - Series, XY Scatter
Step Line Chart Shapes: - Line, Tape, Tube, Ellipsoid
Pie Charts - available in 2D and 3D - A Pie Chart is a circular chart divided into sectors, where the arc length of each sector is proportional to the quantity it represents. Pie Chart data labels support - Center, Rim, Spider and Nonoverlapping Labels.
Pie Chart Shapes: - Pie, Torus, Smooth Edge Pie, Cut Edge Pie, Ring (Donut), Smooth Edge Ring, Cut Edge Ring
Point Charts - available in 2D and 3D - Point Charts display 1, 2 or 3-dimensional data as points in a Cartesian coordinate system. They are often used for XY and XYZ scatter plots especially when a large number of data points need to be displayed.
Point Chart Subtypes: - Series, XY Scatter, XYZ Scatter
Point Chart Shapes: - Bar, Cylinder, Cone, Inverted Cone, Pyramid, Inverted Pyramid, Sphere, Ellipse, Cross, Diagonal Cross, Line Cross, Line Diagonal Cross, Star
Bubble Charts - available in 2D and 3D - Bubble Charts display multi dimensional data as points in a Cartesian coordinate system. The size of each point is determined by an additional size value. The actual size of the bubble is interpolated to be in the MinSize - MaxSize range.
Bubble Chart Subtypes: - Series, XY Scatter, XYZ Scatter
Bubble Chart Shapes: - Bar, Cylinder, Cone, Inverted Cone, Pyramid, Inverted Pyramid, Sphere, Ellipse, Cross, Diagonal Cross, Line Cross, Line Diagonal Cross, Star
Float Bar Charts - available in 2D and 3D - A Floating Bar Chart displays a sequence of vertical bars, each bar representing a one-dimensional value range. A Floating Bar chart can be used as a Gantt chart if the Y axis is in date-time scale mode. Gantt charts are popular in project management for planning the use of resources over time.
Float Bar Chart Subtypes: - Series, Clustered, Stacked, XY Scatter, XYZ Scatter, XYZ Scatter Stacked
Float Bar Chart Shapes: - Bar, Cylinder, Cone, Inverted Cone, Pyramid, Inverted Pyramid, Ellipsoid, Smooth Edge Bar, Cut Edge Bar
High Low Charts - available in 2D and 3D - A High-Low Chart displays a sequence of data points, each representing a one-dimensional value range. The begin values of consecutive data points are connected with a "low" line. The end values are connected with a "high" line. The area between these two lines is filled with different colors, depending on whether the "high" line runs above or below the "low" line.
High-Low Chart Subtypes: - Series, XY Scatter
Stock Charts - available in 2D and 3D - Stock charts are used to plot stock data, usually over time. Stock charts use color coding to distinguish between stock prices, which went up or down when the stock closed.
Stock Chart Subtypes: - Series, XY Scatter
Stock Chart Shapes: - OHLC stick, HLC stick, Candle Stick
Funnel Charts - available in 2D and 3D - The Funnel Chart is similar to a Stacked Percent Bar Chart with only one category. It represents 100% of the summary values for the data items included in the chart. Funnel Charts are often used to represent stages in a sales process and show the amount of potential revenue for each stage. This type of chart can also be useful in identifying potential problem areas in an organization's sales processes. Nevron Funnel Chart provides control over labeling, neck width and height and points gap.
Radar Charts - available only in 2D - A Radar Chart plots the values of each category along a separate axis that radiates from the center of the chart and ends on the outer ring. A line connects all the values from the same series and optionally the area enclosed by the line can be filled.
Radar Chart Subtypes: - Lines, Areas
Polar Charts - available only in 2D - Polar Charts display 2-dimensional data points in a polar coordinate system. The position of a point is specified by its distance from the center and a rotation angle. The points are connected by a line and optionally the area enclosed by the line can be filled.
Polar Chart Subtypes:- Lines, Areas, Points
Surface Charts - available only in 3D - Surface Charts display a surface connecting the adjacent data points. Multiple series are not supported by surface charts. That is why only one series is created which takes the properties of the first values data grouping displayed in the Surface Chart chart area. Additional series append values to this series (in the case of a Mesh Surface) or add depth to the surface grid (in the case of Grid Surface).
Surface Chart Subtypes:- Grid, Mesh, Triangulated
Drawing Modes:- Scaled, Flat at Axis Begin, Flat and Axis End
Combo Charts - available in 2D and 3D - Combo Charts are used to combine certain series types within the same chart area. Series types are specified per values data groupings. There are many per series type options. You can combine the following series types: Bar, Area, Smooth Area, Line, Smooth Line, Step Line, Point, Bubble, High Low and Stock.
Combo Charts Subtypes:- Series, XY Scatter
Nevron Chart for SharePoint Chart Axes Features - Complete set of axis-related features designed to target even the most compelling charting requirements. The axes are largely automatic, allowing you to focus on your project, but if needed you can customize every aspect of their appearance and behavior.
Primary and Secondary X and Y Axes - Nevron Chart for SharePoint supports Primary and Secondary X and Y Axes. You can specify the X and Y axes on which each values data grouping (chart series) is scaled. Advanced settings allow you to make use of axis crossings, docking and percent positioning.
Depth Axis - In 3D charting, the axis model is extended with an additional depth (Z) axis. The Z axis allows data to be plotted along the depth of the chart. It automatically scales in Numeric or Categorical scale mode, allowing the creation of XYZ scatters and XZ-plane categorical plots.
Special Radar and Polar Axes - Special Radar and Polar axes are exposed for Radar and Polar charting types. These aim to provide advanced settings for complex requirements related to these charting types.
Numeric Scale - The Numeric Scale is automatically selected, depending on the respective chart dimension type. The following sub-modes are available:
Number scale - displays any data in numeric format (profit, sales, percentages etc.)
Angular scale - displays angular data in degrees, radians or grads (used in polar charts).
DateTime scale - suitable for display of date-time data.
ValueTimeline scale - advanced date-time scale, widely used in financial charts.
RangeTimeline scale - advanced date-time scale, widely used in financial and project management charts.
Categorical Scale - The Categorical Scale is automatically selected, depending on the respective chart dimension type. It has the following advanced features: supports unlimited grouping levels, grouped and single-row labels, mutliple presets for groupings appearance and layout.
Advanced Axis Positioning Options - Axes can be docked to the chart sides (or polar rim) or crossed with another axis (at value or percent). In addition, axes can share a single chart edge.
Axis Title - Full control over the appearance, position and angle of the axis titles. The axis titles text supports advanced rich-text formatting.
Ruler - Control over the begin and end ruler caps appearance and shape. Option to highlight scale breaks on the ruler.
Axis Range - Nevron Chart for SharePoint provides control over the axis range. Ability to inflate that range in several modes.
Gridlines - Nevron Chart for SharePoint supports major and minor gridlines, with full appearance customization and control over the walls on which they are displayed.
Ticks - Support for major and minor ticks with control over their appearance and position.
Axis Stripes - Axis Stripes highlight repeating ranges of data on the chart walls, with a controllable show/hide pattern.
Axis Sections - Axis Sections conditionally modify the appearance of axis ticks, gridlines and labels, provided they are within a user-specified data range(s). This feature helps you to highlight important ranges of data along the axis.
Const Lines - Const Lines show constant lines (reference lines) at user-specified value(s). In 3D mode they are displayed as planes perpendicular to their owner axis.
Breaks - Axis Scale Breaks skip a range of values on the axis. They are used to increase the readability of the chart, in cases when the data is clustered in distant data ranges (for example: half the data points are around 100 and the other half are around 1,000,000). Without scale breaks, such data cannot be visually compared. Nevron Chart for SharePoint provides support for manual and automatic scale breaks with full control over appearance and behavior. X and Y scale breaks can be crossed. Scale breaks are also displayed in 3D Mode (unique feature).
Label Layout - Nevron Chart for SharePoint provides advanced axis-label layout options, which let you resolve very complex axis-label overlapping cases.
Label Formatting - Label Formatting controls the formatting of values along numeric scales. Many advanced options for currency, percentage, scientific and date time label formatting are available.
Nevron Chart for SharePoint Data Aggregation Features
Nevron Chart for SharePoint uses the Nevron Pivot Data Aggregation Engine. A simplified pivot charting model was first introduced in MS Excel - if you are using this feature of MS Excel then you already know the basics of pivot charting and its power.
In MS Excel, data groupings are simply created for field values and a predefined set of aggregate functions are available for calculating the series data point values.
In Nevron Chart for SharePoint you use expressions to define how the data is grouped, filtered and sorted. Expressions can reference field values from the data set and you can use numerous mathematical, statistical, logical, date-time, and text functions to define complex grouping, filtering and sorting rules. Special aggregate functions are available for computing aggregate values (like sum, average etc.)
Because the Nevron Pivot Data Aggregation Engine is data source invariant, this allows you to create pivot charts from any data source, which can provide a table representation of its data.
Because Nevron Chart for SharePoint and Nevron Chart for Reporting Services are built on top of the Nevron Pivot Component framework, they are generally having the same functionality and features. This helps you streamline your IT reporting efforts and reduce your IT staff learning curve - be it SharePoint or Reporting Services - you know that Nevron provides the same powerful and consistent pivot charting functionality.
Nevron Chart for SharePoint Additional Customization Properties – The following is a brief list of some of the most important additional customization options that are visually exposed by the chart designer:
Walls
Walls visibility
Walls appearance
Walls depth (in 3D)
Legends
Advanced positioning options
Items layout preferences
Control over legend marks
Header and Footer
Gridlines
Stripes
Per Series (Values Data Groupings) Properties
Series options (for combo charts)
Display on chart area
Display on X axes
Display on Y axes
Display on legend
Markers - control over shape, size, position and appearance
Legend - control over the data describing the series in the legend
Data Labels - control over format, appearance and layout
Action - tooltips, jump to URL
Data Groupings Editors
Edit grouping expressions
Edit filter expressions
Edit sorting expressions and direction
Rendering
Support for different image formats
Specify resolution
Image sizing options
Gray scale rendering
On/off image map rendering
Control over the currently used culture settings. You can select a custom culture or synchronize the currently used culture with the user regional settings.
Appearance Customizations
Fill Style editor - helps you define the filling of an element. Provides options for solid color, gradient, image and advanced gradient fill types.
Stroke Style editor - helps you define the outline/stroke of an element. Provides options for line caps and joins, line pattern and color.
Shadow Style editor - helps you define the shadow which is casted by an element. Provides options for solid, linear, radial blur and gaussian blur shadows.
Text Style editor - helps you define the default appearance of a text element. Provides options for font size and type, font filling, outline, shadow, backplane etc.
Frame Style editor - helps you define the frame of the component and its panels. Supports artistic/image borders.
Nevron Chart for SharePoint Advanced Features
Speed - Nevron Chart for SharePoint is a fast rendering chart inside SharePoint - in both 2D and 3D modes.
3D Charting - Nevron Chart for SharePoint includes 3D layouts and an advanced 3D feature set including: 11 predefined lighting modes, ability to specify element materials (control the way in which elements reflect light), largest charting types set in 3D, biggest set of shapes in 3D (applicable to pies, bars, markers, areas etc.)
2D Charting - Nevron Chart for SharePoint is a chart for SharePoint environment to provide Adobe Photoshop like image filter effects, which are applicable to all chart elements - these include bevel, emboss, lighting filters etc. When it comes to shadows it is the only chart for Share Point, which has soft shadows (based on Gaussian and Radial blur image filters).
2D/3D Consistency - Nevron Chart for SharePoint is consistent in 2D/3D modes. For example you can map gradients to elements in both 2D and 3D. Colors specified in 2D are inherited by materials in 3D. You can mix 2D and 3D chart areas in a single chart control.
XY and XYZ scatters - Nevron Chart for SharePoint includes support for XY and XYZ scatters inside SharePoint.
Nevron Vision for SharePoint 2010 Vol. 1 introduces:
The leading gauge web part for SharePoint
Both charts and gauges can now bind the Excel Services
You can inject custom code in both charts and a gauges
Actions can now be associated with the chart walls and axes.
New visual expression editor (Fx editor) that lets you author expressions visually and more quickly. The Fx editor is available anywhere an expression can be specified (grouping, filtering, sorting expressions, titles, labels, chart data values, gauge formulas etc).
New statistical functions - MEDIAN, PERCENTILE, VARIANCE and STDDEV
New type functions - TONUM, TODATETIME, TOBOOL
Fixed problems:
Visually the rendering Width/Height of the chart was clamped on specific non English servers (language dependant).
Text editors are now implemented as text areas, thus allowing for texts with any markup to be used.
The chart interference problem with other third party web parts has been fixed.
Deliver advanced charting solutions to the SharePoint environment.
PartNumbers: PC-534201-274422 534201-274422 PC-534201-274423 534201-274423 PC-534201-274424 534201-274424 PC-534201-274425 534201-274425 PC-534201-274426 534201-274426 PC-534201-274427 534201-274427 PC-534201-274428 534201-274428 PC-534201-274429 534201-274429 PC-534201-274430 534201-274430 PC-534201-274431 534201-274431 PC-534201-274432 534201-274432 PC-534201-274433 534201-274433 PC-534201-274434 534201-274434 PC-534201-274435 534201-274435 PC-534201-274436 534201-274436 PC-534201-274437 534201-274437 PC-534201-274438 534201-274438 PC-534201-274439 534201-274439 PC-534201-274440 534201-274440 PC-534201-274441 534201-274441 PC-534201-274442 534201-274442 PC-534201-274443 534201-274443 PC-534201-274444 534201-274444 PC-534201-274445 534201-274445 PC-534201-274446 534201-274446
Publisher PartNumbers: N.CH.SP.92.ENT N.CH.SP.92.ENT.SSCR N.CH.SP.92.ENT+SSCR N.CH.SP.92.ENT+SSCR+SUP.GOLD N.CH.SP.92.ENT+SSCR+SUP.SILVER
PurchaseOptions: Nevron Chart for SharePoint 2010 Vol.1 Special Offer - Ends 31st March 2010 1 Server License, Nevron Chart for SharePoint 2010 Vol.1 Special Offer - Ends 31st March 2010 1 Server License, per Server from 3 up to 4 Servers (Minimum quantity 3), Nevron Chart for SharePoint 2010 Vol.1 Special Offer - Ends 31st March 2010 1 Server License, per Server from 5 up to 9 Servers (Minimum quantity 5), Nevron Chart for SharePoint 2010 Vol.1 Special Offer - Ends 31st March 2010 1 Server License, per Server from 10 up to 19 Servers (Minimum quantity 10), Nevron Chart for SharePoint 2010 Vol.1 Special Offer - Ends 31st March 2010 1 Server License, per Server from 20 Servers (Minimum quantity 20), Nevron Chart for SharePoint 2010 Vol.1 with Subscription Special Offer - Ends 31st March 2010 1 Server License with Subscription, Nevron Chart for SharePoint 2010 Vol.1 with Subscription Special Offer - Ends 31st March 2010 1 Server License with Subscription, per Server from 3 up to 4 Servers (Minimum quantity 3), Nevron Chart for SharePoint 2010 Vol.1 with Subscription Special Offer - Ends 31st March 2010 1 Server License with Subscription, per Server from 5 up to 9 Servers (Minimum quantity 5), Nevron Chart for SharePoint 2010 Vol.1 with Subscription Special Offer - Ends 31st March 2010 1 Server License with Subscription, per Server from 10 up to 19 Servers (Minimum quantity 10), Nevron Chart for SharePoint 2010 Vol.1 with Subscription Special Offer - Ends 31st March 2010 1 Server License with Subscription, per Server from 20 Servers (Minimum quantity 20), Nevron Chart for SharePoint 2010 Vol.1 with Subscription + Priority Support Service Special Offer - Ends 31st March 2010 1 Server License with Subscription + Priority Support Service for 1 year, Nevron Chart for SharePoint 2010 Vol.1 with Subscription + Priority Support Service Special Offer - Ends 31st March 2010 1 Server License with Subscription + Priority Support Service for 1 year, per Server from 3 up to 4 Servers (Minimum quantity 3), Nevron Chart for SharePoint 2010 Vol.1 with Subscription + Priority Support Service Special Offer - Ends 31st March 2010 1 Server License with Subscription + Priority Support Service, per Server from 5 up to 9 Servers (Minimum quantity 5), Nevron Chart for SharePoint 2010 Vol.1 with Subscription + Priority Support Service Special Offer - Ends 31st March 2010 1 Server License with Subscription + Priority Support Service, per Server from 10 up to 19 Servers (Minimum quantity 10), Nevron Chart for SharePoint 2010 Vol.1 with Subscription + Priority Support Service Special Offer - Ends 31st March 2010 1 Server License with Subscription + Priority Support Service, per Server from 20 Servers (Minimum quantity 20), Nevron Chart for SharePoint 2010 Vol.1 with Subscription + Premium Support Service Special Offer - Ends 31st March 2010 1 Server License with Subscription + Premium Support Service for 1 year, Nevron Chart for SharePoint 2010 Vol.1 with Subscription + Premium Support Service Special Offer - Ends 31st March 2010 1 Server License with Subscription + Premium Support Service for 1 year, per Server from 3 up to 4 Servers (Minimum quantity 3), Nevron Chart for SharePoint 2010 Vol.1 with Subscription + Premium Support Service Special Offer - Ends 31st March 2010 1 Server License with Subscription + Premium Support Service, per Server from 5 up to 9 Servers (Minimum quantity 5), Nevron Chart for SharePoint 2010 Vol.1 with Subscription + Premium Support Service Special Offer - Ends 31st March 2010
Resources: Read the Nevron Vision for SharePoint help file, Read the Nevron License Agreement, Download the Nevron Vision for SharePoint 2010 Vol.1 evaluation on to your computer - Displays Evaluation Messages
Operating System for Deployment: Windows 7, Windows Server 2008, Windows Server 2003
Architecture of Product: 32Bit, 64Bit
Product Type: Add-In
Component Type: ASP.NET AJAX (ATLAS), .NET Class
Compatible Containers: Microsoft SharePoint Portal Server, Microsoft Office SharePoint Server (MOSS), Microsoft Windows SharePoint Services
Keywords: Reporting Reports Report On-Line Analytical OLAP analysis analyze analyse Nevron Chart Charting Charts Graph Graphing Graphs Corporate Partner nevron, sharepoint, share point, chart charting, graph, graphing
Publisher
Primary Category
Related Products
Related Categories