Web Form specific features.
Stacked Bar Chart
Dual Axis
Realtime Data
Combo Charts
Line Studies
Gauges - Axis Selection
Gauges - Rane Labels
Custom Labels
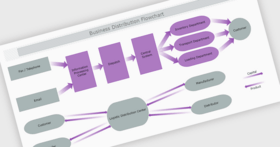
Financial Dashboard
Digital Clock
Cluster-Stacked-Bar ChartClustering and stacking may be combined into the same chart. In a 3D scene, clustered and stacked series may be distributed in different depths.
XYZ Stack BarsXYZ rendering of stacking and clustering.
Pie Chart - Torus ModeA pie chart may be rendered in different shapes - standard and smooth edge pie, standard, smooth edge or cut edge ring and torus, thus increasing the diversity of chart looks available for advertisements and presentations. The data labels are visualized in Spider Mode - aligned in columns on the left and right side of the pie.
XYZ Line Chart - Lorenz AttractorXYZ Line Chart representing Lorenz Attractor – a complex fractal structure corresponding to the long-term behavior of a 3-dimensional dynamic system that exhibits chaotic flow and evolving without ever crossing itself.
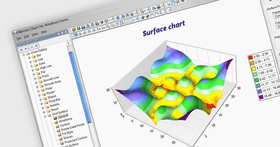
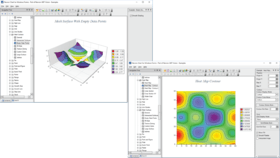
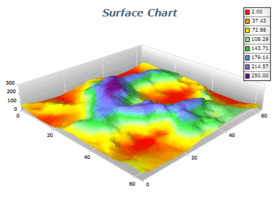
Mesh Surface ChartThe Mesh Surface chart displays a surface with user-defined y-position, x-position and z-position values for each data point, in contrast to Grid Surface where only y-position (elevation) is user defined. Data points are ordered in a regular network.
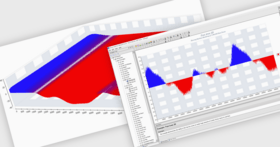
Candle Stock ChartCandle charts are used to plot daily stock data. Each data point resembles a candle, where the candle body is formed by the open and close prices for the day. The high and low prices are displayed by vertical lines above and below the candle body. The body fill color depends on whether the stock price goes up (the closing price is higher than the opening price) or down (the closing price is lower than the opening price).
Radar Line ChartRadar Series, used to create a Radar Chart (Spider Chart, Star Chart), is rendered to a circular graph and is used primarily as a multi-parameter data comparison tool.
Surface Chart with TextureThe Grid surface series supports a Fill Effect for the whole surface. The user can apply images, gradients, advanced gradients and patterns to the surface, as well as modify material properties like Specular Color, Emissive Color and Shininess.
Multiple Axes FeaturesThis screenshot demonstrates the following capabilities: adding axes to the left and to the right of the chart back wall; using different and, by need, synchronized scales; using grid lines and major ticks; applying different styles to axes; using stripes; staggering axis labels.
Synchronized Detached AxesThis screenshot demonstrates the following capabilities: adding synchronized detached axes; rotating axis labels.
Const Lines and StripesThis screenshot demonstrates the following capabilities: using const lines; using stripes.
Major and Minor TicksThis screenshot demonstrates the following capabilities: using major and minor ticks; translating the coordinate system center; using major and minor grid lines.
Logarithmic ScaleThis screenshot demonstrates the following capabilities: using logarithmic scale; setting custom axis label format.
Multiple Gauges Parent Radial LayoutLayout combination of Radial Gauge, three radial sub-gauge areas and Numeric Display Panel. Demonstrates the parent radial layout feature that allows placement of child gauges at specified angle and offset from center.
Vertical Linear GaugeLinear Gauge displays axes, ranges and pointers in a linear fashion with different styles. Nevron Linear Gauge can be used for the creation of complex gauges, KPIs, Scorecards and Dashboards. The example demonstrates Vertical Gauges with multiple indicators.
Horizontal Linear GaugeLinear Gauge displays axes, ranges and pointers in a linear fashion with different styles. Nevron Linear Gauge can be used for the creation of complex gauges, KPIs, Scorecards and Dashboards. The example demonstrates combination of Linear Gauge, Numeric Display and State Indicator.
Numeric Led DisplayNumeric displays are used to visualize a floating point value in Light-Emitting Diode (LED) fashion. Nevron Numeric Display panel is very useful to display numerical information (values) in LED fashion with different styles. The example demonstrates combination of Numeric Display and State Indicator.
Radial Gauge IndicatorsGauge Indicators are showing important values, ranges or states on the gauge. Nevron Gauge can be used for the creation of complex gauges, KPIs, Scorecards and Dashboards. The example demonstrates combination of Radial Gauges with Needle Indicator, multiple Range and State Indicators.
Knob IndicatorGauge Indicators are showing important values, ranges or states on the gauge. Nevron Gauge can be used for the creation of complex gauges, KPIs, Scorecards and Dashboards. The example demonstrates combination of Radial Gauges with Needle Indicator, multiple Range and State Indicators.
Print ManagerAdvanced built-in printing and print - preview support.
Built in UI componentsGrid and Toolbar components for WinForms. The grid is data aware and supports true date time editing as well as fill effect, line style and cursor type editing. The most frequently used commands are exposed by the Toolbar, which also supports custom buttons and runtime visual configuration.
Screenshot of Nevron Chart for .NET
Screenshot of Nevron Chart for .NET
Screenshot of Nevron Chart for .NET