Heat Map ChartsThe Heat Map charts represents data in a tabular format with user-defined color ranges like low, average and high. It is used to plot complex data like performance comparison of different companies, periodic table, employee attendance, stock market investments and the like. Using the heat map charts from PowerCharts XT, you can see all data sets lying in a particular color range just by selecting it.
Radar (Spider Charts)The Radar chart is a very effective tool for comparing multiple entities based on different characteristics. For instance, they can be used for comparing various cars based on their fuel efficiency, maneuverability, pick-up and engine power.
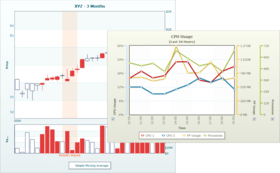
Candlestick ChartThe candlestick chart offers you a powerful and interactive interface to plot your stock data. It offers the following features: Integrated price and volume plot. Volume plot can be turned on or off. Multiple options for price plotting - Candlestick / bar / line. Interactive tool tip and customizable hover bar. Allows you to plot trend lines and zones on the chart. Apart from trend lines and zones, you can plot any number of custom trend sets on the chart. These trend sets can be customized to show any technical indicators. You can easily provide missing data using this chart. Any particular candle can be highlighted using color combination. Vertical indicator lines can be drawn at any point on x-axis.
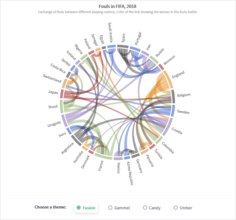
Drag-node ChartThe drag-node chart is a specialized type of chart where each data set is shown on the chart as a drag-able node. Perfect for network diagrams, hierarchy structures etc. this chart provides a highly intuitive interface for your end users to visually adjust related entities, link them and even add new ones. You can take visual inputs from your users using this chart and then submit the final positions of the nodes to your scripts for further processing.
Multi-axis Line ChartThe multi-axis line chart from PowerCharts suite is an interactive line chart that allows for the following feaures: Multiple axis on the same chart. Interactive axis, that allow the end user to show/hide data-sets (lines) plotting against that axis. Options to make the axis visible or imaginary. Option to draw the axis on left or right side of chart. Interactive options like dynamic sliding of axis from one end to other, upon clicking. Ability to plot multiple data-sets against the same axis. Axis specific properties like: Upper and lower limits, Cosmetic Properties of axis, Divisional Lines, Cosmetic properties of datasets plotting against the particular axis, Number Formatting.
Select Scatter ChartThe Select Scatter chart is a special type of chart that allows users to visually select a subset of data from the given data points. Essentially, it's a extension of XY Plot Chart (Scatter Chart) from FusionCharts v3 with the added functionality of selecting any number of points on the chart and returning them back to server (or JavaScript functions for further processing).
Multiple UsesPowerCharts can be used for a variety of purposes like simulations, visual data selection, scientific plotting, financial analysis etc.
Logarithmic ChartsPowerCharts introduces logarithmic charts in the suite. The logarithmic column and line charts are very similar to the normal charts, but for the fact that these charts use a logarithmic axis instead of a normal linear axis. Since these charts derive from the normal v3 charts, the feature set provided is the same. Currently, there are 2 logarithmic charts present in the suite: Logarithmic Column 2D Chart and Logarithmic Line 2D Chart
Spline ChartA spline chart is a chart that plots a fitted curve through every data point in a series. PowerCharts includes Spline Chart, Spline Area Chart, Multi-Series Spline Chart and Multi-Series Area Chart.
Kagi ChartA type of chart developed by the Japanese in the 1870s that uses a series of vertical lines to illustrate general levels of supply and demand for certain assets. Thick lines are drawn when the price of the underlying asset breaks above the previous high price and is interpreted as an increase in demand for the asset. Thin lines are used to represent increased supply when the price falls below the previous low.