by Red Gate Software - Product Type: Application / Developer Application
ANTS Memory Profiler by Red Gate Software
URLs: red-gate-ants-memory-profiler, red gate ants memory profiler, redgateantsmemoryprofiler, red-gate, red gate, redgate
Memory profiling for .NET developers. ANTS Memory Profiler makes .NET memory profiling simple. Use ANTS Memory Profiler to locate memory leaks, optimize applications with high memory usage, and check the health of your code during the development cycle and before release. ANTS Memory Profiler can profile any .NET application including ASP.NET web applications. It is available as a standalone tool and as part of the Red Gate .NET Developer Bundle.
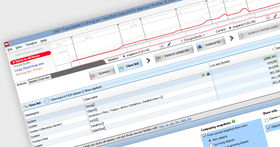
ANTS Memory Profiler - .NET memory profiling made simple.
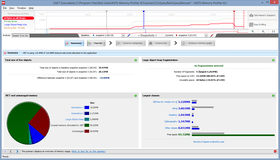
ANTS Memory Profiler presents memory profile results in a clear way.
Automatic memory management in .NET makes development a lot easier; however, it's still easy to introduce memory leaks into your application. For example, in a complex application, it's easy to forget to unregister event handlers, and these are notorious for holding on to objects which you don't need to keep in memory any more. This typically leads to an increase in memory usage, which can lead to your application exhibiting poor performance, or even running out of memory and crashing, if it remains unchecked and unresolved. This is where a memory profiler becomes necessary.
Why is it easy to work with ANTS Memory Profiler 5?
It shows you where to start, by taking you through the most effective workflow
It displays profiling results in a clear, meaningful way, making it easier for you to interpret the information
It displays the relationship between objects using graphical representations, so you don't have to build a mental map of your applications' memory usage in your head
It offers powerful filtering options, so you can narrow your search down to the object you really need to know about. Filters will help in the analysis of even the most complicated applications
ANTS Memory Profiler Features:
Ability to take and analyse an arbitrarily large number of memory snapshots
Support for snapshots up to 2GB (32-bit operating systems), and 4GB (64-bit operating systems)
Arbitrary snapshot comparisons
Summary information for profiling session, individual snapshots, and snapshot comparisons
Large object heap fragmentation statistics
Powerful filtering options to narrow your search down to the objects you really need to know about. Standard object filters and advanced object filters available
Unique class reference view which allows you to quickly see where instances of a given class are being referenced
Object retention graph quickly allows you to see the shortest reference paths to all GC roots which will need to be broken to fix memory leaks
One-step Set-up dialog
Ability to profile .NET executables, ASP.NET applications and web services in IIS and web development server, services, COM+ applications, and XBAP applications
Integration with Visual Studio 2005 and 2008, so you can start profiling your application from within your IDE. One click launches ANTS Memory Profiler within seconds, with the executable path already set
Feature list:
Profile any .NET language. It doesn't matter whether you're programming in C#, VB.NET, managed C++, or in COBOL.NET. If you're programming for the .NET Framework, then ANTS Profiler can help you
Profile ASP.NET web applications so you can identify slow code in your .NET websites and web services. ANTS Profiler will identify slow-loading pages and, more importantly, tell you why they are slow
Profile Windows Forms applications so you can optimize rich, client-side applications
Profile .NET 3.0 and .NET 3.5 applications - WCF (Indigo), WPF (Avalon), WF, XBAP
Profile web applications on IIS 5, IIS 5.1, IIS 6, IIS 7, and ASP.NET Development Web Server (Cassini)
Support for 64-bit profiling on x64 processors
Integration with Visual Studio 2005 and 2008, so you can start profiling your application from within your IDE. One click launches ANTS Profiler within seconds, with the executable path already set. Context sensitivity lets you set up what method, class or namespace you want to profile, without having to remember its name
Timeline for zeroing in on problem code; select a region of activity and view the data just for that region
Call tree which auto-expands the worst performing stack traces
Call graph for visualizing all the callers and callees for a particular method
Additional features available in ANTS Profiler Pro
Method-level profiling (faster mode) which introduces less overhead than when the profiler also records line-level timings
Profile memory to understand how your application uses memory, and to locate memory leaks. The memory profiler allows you to take snapshots at any point in the execution of your program, so you can see what memory is in use at that point. You can take multiple snapshots at different times while your application is running, so you can compare application memory states
ANTS Memory Profiler 7.0 Release Notes
Features and Enhancements
ANTS Memory Profiler 7 includes a number of new features and enhancements:
Redesigned summary. This gives immediate feedback on where your memory is being used, and now warns you if problems with large object heap fragmentation are detected.
New Instance Categorizer graph. Groups the instances of the class that you are investigating by the shortest path to the GC root, allowing you quickly to spot any paths that should not hold references to the instances.
Redesigned and reorganized filters.
New 'show only survivors in growing classes' filter highlights any classes where no instances were disposed between two snapshots, even though the number of instances of that class increased.
Field properties now available on the Instance Retention Graph.
Improved support for WPF: Dependency properties now shown with other field properties.
Snapshot API lets you take snapshots from your code.
Supported Application Types
Executable
ASP.NET web application (running in IIS or web development server)
Silverlight 4 browser application
Windows service
COM+ server application
XBAP
Supported .NET Framework Versions
Your application must be built for one of the following .NET framework versions:
1.1
2.0
3.0
3.5
4.0
Silverlight 4
The .NET 2.0 runtime must be installed for ANTS Memory Profiler to run.
Supported OS Versions
Windows XP SP2 or later
Windows Server 2003
Windows Vista
Windows Server 2008
Windows 7
Windows Server 2008 R2
Supports 32-bit and 64-bit versions of all listed OSs. Windows 2000 is no longer supported.
The following feature requires the .NET 4.0 runtime and Windows Vista or later:
Attach to process
Other System Requirements
512 MB RAM (minimum)
Internet Explorer 6+
1 GB free hard disk space
To use the ANTS Memory Profiler 7 add-in, you need at least one of the following versions of Microsoft Visual Studio:
Visual Studio 2005
Visual Studio 2008
Visual Studio 2010
Known Issues
For some types of application, you may have to run ANTS Memory Profiler as an administrator.
If you have Internet Explorer 7 on Windows Vista x64 or Windows Server 2008 x64, it is not possible to profile ASP.NET websites on IIS. Upgrading to Internet Explorer 8 will solve this problem.
On Windows Vista and Windows 7, after profiling IIS using attach to process, ANTS Memory Profiler 7 sometimes cannot stop the session. If this happens, restart ANTS Memory Profiler before starting a new profiling session.
In some cases, Windows Services do not restart properly after profiling. Use services.msc to restart services if required.
To profile an XBAP application, Internet Explorer must be set as your default browser and it must be closed before profiling.
To profile a .NET 4 process, you must first disable concurrent garbage collection.
A limitation in Windows means that it is not possible to successfully attach to a .NET 4 process more than once.
SharePoint 2010 is not supported.
The snapshot API does not work with Silverlight applications, due to security restrictions in Silverlight.
ANTS Memory Profiler 5.2
This latest version of Red Gate’s superfast, award winning memory profiler contains numerous important bug fixes, and is a recommended upgrade for all users of ANTS Memory Profiler 5.0 and 5.1:
Fixed infinite progress hang when taking a snapshot whilst profiling Sharepoint.
Now warns about object reference fix-up problem when running application with Server GC; this has been raised as a bug on Microsoft Connect at https://connect.microsoft.com/VisualStudio/feedback/ViewFeedback.aspx?FeedbackID=483764.
Fixed CouldNotMapFileException when profiling an application with more than 46,000,000 objects on a 32-bit system.
Fixed problem where Dispose tracking only worked on debug, non-optimized builds.
Fixed problem where cross-assembly references can cause a crash when multiple AppDomains are used.
Fixed intermittent GDI+ errors caused by summary view graphs.
Fixed server error from “What do I look for?” help link at bottom of class graph.
Corrected support forum URL on Getting Started form.
Memory profiling for .NET developers.
Pricing: ANTS Memory Profiler 7.0 1 User License, ANTS Memory Profiler 7.0 5 User License, ANTS Memory Profiler 7.0 10 User License, ANTS Memory Profiler 7.0 with 12 Months of Support and Upgrades 1 User License, ANTS Memory Profiler 7.0 with 12 Months of Support and Upgrades 5 User License, ANTS Memory Profiler 7.0 with 12 Months of Support and Upgrades 10 User License, ANTS Memory Profiler 7.0 with 24 Months of Support and Upgrades 1 User License, ANTS Memory Profiler 7.0 with 24 Months of Support and Upgrades 5 User License, ANTS Memory Profiler 7.0 with 24 Months of Support and Upgrades 10 User License, ANTS Memory Profiler 7.0 with 36 Months of Support and Upgrades 1 User License, ANTS Memory Profiler 7.0 with 36 Months of Support and Upgrades 5 User License, ANTS Memory Profiler 7.0 with 36 Months of Support and Upgrades 10 User License, ANTS Memory Profiler 7.0 Renewal License - 12 Months of Support and Upgrades 1 User Renewal License, ANTS Memory Profiler 7.0 Renewal License - 12 Months of Support and Upgrades 5 User Renewal License, ANTS Memory Profiler 7.0 Renewal License - 12 Months of Support and Upgrades 10 User Renewal License, ANTS Memory Profiler 7.0 Renewal License - 24 Months of Support and Upgrades 1 User Renewal License, ANTS Memory Profiler 7.0 Renewal License - 24 Months of Support and Upgrades 5 User Renewal License, ANTS Memory Profiler 7.0 Renewal License - 24 Months of Support and Upgrades 10 User Renewal License, ANTS Memory Profiler 7.0 Renewal License - 36 Months of Support and Upgrades 1 User Renewal License, ANTS Memory Profiler 7.0 Renewal License - 36 Months of Support and Upgrades 5 User Renewal License, ANTS Memory Profiler 7.0 Renewal License - 36 Months of Support and Upgrades 10 User Renewal License
Evals & Downloads: Read the ANTS Memory Profiler help file, Read the ANTS Memory Profiler Data sheet, Read the ANTS Performance Profiler Data sheet, Read the ANTS Profiler End User License Agreement, Download the Red Gate .NET Developer Bundle evaluation on to your computer - Expires after 14 days
Operating System for Deployment: Windows 7, Windows Server 2008, Windows Vista, Windows XP, Windows Server 2003
Architecture of Product: 32Bit, 64Bit
Product Type: Application
Application Type: Developer Application
Built Using: .NET Framework 2.x
Compatible Containers: Microsoft Visual Studio 2010, Microsoft Visual Studio 2008, Microsoft Visual Studio 2005, Microsoft Visual Basic 2010, Microsoft Visual Basic 2008, Microsoft Visual Basic 2005, Microsoft Visual C++ 2010, Microsoft Visual C++ 2008, Microsoft Visual C++ 2005, Microsoft Visual C# 2010, Microsoft Visual C# 2008, Microsoft Visual C# 2005, .NET Framework 4.0, .NET Framework 3.5, .NET Framework 3.0, .NET Framework 2.0, Silverlight 4
Keywords: ant profiler, profiler ants, ants profiling, ants profiler, ants memory profiler, ants profiler 7, redgate ant profiler, redgate profiler ants, redgate ants profiling, redgate ants profiler, redgate ants memory profiler, red gate ant profiler, red gate profiler ants, red gate ants profiling, red gate ants profiler, red gate ants memory profiler, buy ant profiler, buy profiler ants, buy ants profiling, buy ants profiler, buy ants memory profiler, buy ants profiler 7, purchase ant profiler, purchase profiler ants, purchase ants profiling, purchase ants profiler, purchase ants memory profiler, purchase ants profiler 7, ant profiler price, profiler ants price, ants profiler price, ants memory profiler price, ants profiler 7 price, ant profiler reseller, profiler ants reseller, ants profiler reseller, ants memory profiler reseller, ants profiler 7 reseller, ant profiler distributor, profiler ants distributor, ants profiling distributor, ants memory profiler distributor
Red Gate Software Red-Gate RedGate
Debugging debug debugs Testing Test Tests
activex, com, com repair
Development
Part numbers: PC-532777-359693 532777-359693 PC-532777-359696 532777-359696 PC-532777-359699 532777-359699 PC-532777-359702 532777-359702 PC-532777-359705 532777-359705 PC-532777-359708 532777-359708 PC-532777-359711 532777-359711 PC-532777-359714 532777-359714 PC-532777-359717 532777-359717 PC-532777-359720 532777-359720 PC-532777-359723 532777-359723 PC-532777-359726 532777-359726 PC-532777-359729 532777-359729 PC-532777-359732 532777-359732 PC-532777-359735 532777-359735 PC-532777-359738 532777-359738 PC-532777-359741 532777-359741 PC-532777-359744 532777-359744 PC-532777-359747 532777-359747 PC-532777-359750 532777-359750 PC-532777-359753 532777-359753
Mfr. Part No: P77U10M0 P77U10M12 P77U10M24 P77U10M36 P77U1M0 P77U1M12 P77U1M24 P77U1M36 P77U5M0 P77U5M12 P77U5M24 P77U5M36
Publisher
Primary Category
Related Products
Related Categories
ComponentSource offers a unique global service, used by over 1,000,000 software developers worldwide.