Xceed Chart for ASP.NET
by Xceed Software - Product Type: Component / ASP.NET WebForms / 100% Managed Code
Create advanced charts in your ASP.NET projects with this 2D/3D chart component. 
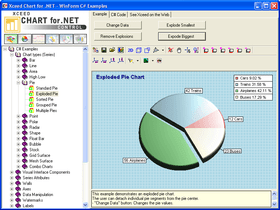
Xceed Chart for ASP.NET is a fast-rendering ASP.NET chart control. It provides all the ASP.NET-specific and web-related tools you need to create 2D and 3D charts. It uses OpenGL (3D/2D) or GDI+ (2D) for fast rendering of charts. Xceed Chart for ASP.NET supports image maps and image response, server-side events with postback, persistent states, chart streaming, script injection, browser detection and automatic temporary file cleanup, out-of-process rendering, and more .It includes 14 major 2D/3D chart types, flexible axes, scaling, legends, drill-down, built-in toolbar and grid, 30+ formulas, samples with source, multi-chart display, SVG support, etc.
Our regular prices are shown below. Please logon to see your discounted prices.
Xceed Chart for ASP.NET V4.2 - Royalty-Free Licenses - Product-only
| Add to Cart |
$ 489.95 |
1 Developer License |
|
Download (82.5 MB) |
| Add to Cart |
$ 1,224.95 |
4 Developer Team License |
|
Download (82.5 MB) |
| Add to Cart |
$ 1,959.95 |
8 Developer Team License |
|
Download (82.5 MB) |
| Add to Cart |
$ 3,919.95 |
20 Developer Team License |
|
Download (82.5 MB) |
| Add to Cart |
$ 11,269.95 |
1 Site Wide License (Allows Unlimited Developers at upto 2 Physical Addresses) |
|
Download (82.5 MB) |
Xceed Chart for ASP.NET V4.2 - Royalty-Free Licenses - Product + 1yr Vanguard
| Add to Cart |
$ 734.95 |
1 Developer License |
|
Download (82.5 MB) |
| Add to Cart |
$ 1,837.45 |
4 Developer Team License |
|
Download (82.5 MB) |
| Add to Cart |
$ 2,939.95 |
8 Developer Team License |
|
Download (82.5 MB) |
| Add to Cart |
$ 5,879.95 |
20 Developer Team License |
|
Download (82.5 MB) |
| Add to Cart |
$ 11,759.95 |
1 Site Wide License (Allows Unlimited Developers at upto 2 Physical Addresses) |
|
Download (82.5 MB) |
Xceed Chart for ASP.NET V4.2 - Royalty-Free Licenses - Blueprint Edition
| Add to Cart |
$ 979.95 |
1 Developer License |
|
Download (82.5 MB) |
| Add to Cart |
$ 2,449.95 |
4 Developer Team License |
|
Download (82.5 MB) |
| Add to Cart |
$ 3,919.95 |
8 Developer Team License |
|
Download (82.5 MB) |
| Add to Cart |
$ 7,839.95 |
20 Developer Team License |
|
Download (82.5 MB) |
| Add to Cart |
$ 15,679.95 |
1 Site Wide License (Allows Unlimited Developers at upto 2 Physical Addresses) |
|
Download (82.5 MB) |
Xceed Chart for ASP.NET V4.2 - Subscription Renewals Before Expiration - 1 year Vanguard
Xceed Chart for ASP.NET V4.2 - Subscription Renewals Before Expiration - Blueprint Edition
Xceed Chart for ASP.NET V4.2 - Subcriptions and Upgrades - 1 year Vanguard
Xceed Chart for ASP.NET V4.2 - Subcriptions and Upgrades - Blueprint Edition
Our prices include ComponentSource technical support and, for most downloadable products, an online backup and a FREE upgrade to the new version if it is released within 30 days of your purchase. All sales are made on our standard Terms and Conditions and subject to our Return Policy. Please contact us if you require any licensing option not listed above including volume licensing and previous versions.
Our regular prices are shown above. Please logon to see your discounted prices.
What's New in Xceed Chart for ASP.NET V4.2?
- GDI+ rendering for sharper 2D charts, data binding, improved interactivity and appearance.
- Full Windows Vista support.
- Compiled against .NET 2.0 (compatible with .NET 3.0).
With Xceed Chart for ASP.NET, you get more than stunning looking charts. Under the hood is a powerful 3D OpenGL chart renderer which generates charts at startling speed and allows you to apply 3D lighting and special scene effects to your charts.
Easy to implement
Xceed Chart for ASP.NET makes it easy to get your WebForms projects to display presentation-quality charts. Here’s why:
- You can work by example. Using the Chart Explorer, just pick the chart type you need to display from over 90 samples, then copy the source code into your project and adjust the parameters
- You can work visually. With the Chart Wizard or the detailed configuration dialogs, you can entirely bypass having to write configuration code
Power Charts
From simple charts to complex business, scientific and financial charts, with Xceed Chart for .NET, you’re covered: 2D/3D bar, line, area, pie, point, bubble, stock, radar, polar, high/low, grid, mesh, shape and more.
ASP.NET features
Xceed Chart for ASP.NET provides various capabilities to make your Web Forms charts interactive and efficient, including:
- Image response. Can generate static images in several formats that are temporarily stored on the server and are used in HTML with an IMG tag.
- Image maps. Can generate HTML image maps with browser redirection to specific URLs, mouse cursor changes and tooltips.
- Image map postback. Can generate interactive charts that fire server-side events for clicks on the chart’s elements.
- Persistent state. The chart’s state on the server can stay persistent across round-trips. State can also be saved or streamed.
- No code-behind. Can be used in an ASPX page with no code-behind, useful for porting legacy ASP applications to ASP.NET.
- Binary stream image. Can stream a chart to the browser without generating a file on the server.
- Web.config support. Configure directly from a web.config file allowing groups of applications to share chart configurations without writing code.
- Inject custom script. Seamlessly integrate image maps generated by the component with any type of client side VBScript or JScript.
- Temp file clean-up. Automatically detects when a temporary file is expired and deletes it from the server. Configurable space usage quota for temp folder.
- Built-in browser detection. .NET regular expressions can instruct the component to generate browser-specific responses.
- Server configuration utility. Allows you to configure web applications that use Xceed Chart for ASP.NET without writing a single line of code.
Features:
.NET technology
- Written entirely in managed C# (except for OpenGL module). Source code will be available in a future Blueprint Edition
- Not a .NET interface over a recycled ActiveX component
- All error handling works through .NET exception classes
- Object-oriented design created specifically for the .NET framework
- 100% Unicode support
- Can be used in C#, VB.NET, and Managed C++
- Fast loading object with efficient memory usage
- Documentation fully integrated into Microsoft Visual Studio .NET
Unique innovations
- Video card hardware acceleration: Frees your CPU from having to draw the chart and transfers all rendering to the video card's GPU
- OpenGL for rendering charts: Creates impressive lighting effects, smooths chart elements using antialiasing and jittering, and provides unique fill effects
- Chart Explorer: An interactive ASP.NET application that demonstrates over 90 different charts. The source code of each example is included with Xceed Chart for ASP.NET
True WYSIWYG design-time and run-time editors
- Over twenty different design-time editors: These allow users to create and modify charts quickly and easily, writing little or no code. State-of-the-art editors with full Visual Studio design-time support allow the creation of charts based on templates and the modification of their data and settings in just a few minutes
- Excel-like fill effect editors: You can not only specify any fill effect that you can specify in Excel, but you can also visually create any custom gradient with the built-in advanced gradient editor
Major ASP.NET features
- Server-side events (postback) and HTML image maps: The image maps generated by the component can display tooltips, redirect the client browser to a specified URL or change the mouse cursor
- Server-side persistence: The component can preserve its state across roundtrips
- Injecting custom client-side script: Any type of client-side VBScript or JScript can be seamlessly integrated into the image maps generated by the component
- Directly streaming an image to the client browser: An indispensable feature when building scalable and secure server-side applications
- Built-in clean up of temporary files: The component automatically detects when a temporary file has expired and deletes it from the server. You can also assign disk space usage quotas for the directory holding the temporary files in order to ensure that you do not exceed the space used by your web server application
- Drill-down capabilities: Supports drill-down with a wide variety of events
- Built-in browser detection: By taking advantage of the power of .NET regular expressions, you can tell the component to generate different responses depending on the browser accessing the page
- Standalone server-side configuration utility: Allows you to configure your web applications and even entire groups of web applications using Xceed.Chart.ServerConfig.exe without writing a single line of code. Can be modified at runtime
Major features
- Wide variety of chart types: Fourteen major chart types are supported, such as the traditional bar, line, and pie series, but also high-low, mesh surface, and grid surface charts, and even a "shape" chart. Different chart types support multiple modes, meaning that literally dozens of different styles and types are available for developers. Many chart types support XY and XYZ scatter modes
- Empty data point support: All chart types support empty data points
- Flexible integrated legend: Many predefined styles, positions, and data layout strategies are provided. Supports headers and footers
- Built-in functions and formula support: The component has extensive custom formula support with 33 predefined functions, including commonly used financial indicators such as Relative Strength Index, MACD, Bollinger Bands, Average True Range, Momentum, Stochastic Oscillator, Directional Movement System, and Moving Averages
- Advanced control over axis scaling and position: Static and dynamic axis positioning strategies and settings. Several predefined text layout schemes. Four scaling modes: DateTime, Numeric, Logarithmic, and Dimension scale. Paging with lots of customizations
- Axis-labeling abilities: Stripes, constant lines as planes or simple lines, custom axis labels
- Display of several chart types simultaneously: Advanced chart margin and fit strategy control
- Display of several series simultaneously: Creating a combination chart has never been easier and more flexible
- Display of multiple charts and legends in the component canvas. Charts can be described on one or more legends. Legends can describe multiple charts
- Image Borders: Impressive skin effects, which add an important final touch to your chart
- Watermarks: Ideal for company logos and trademarks. Can be displayed on top of or behind the chart image with user-controlled transparency
- Labels: Headers, footers, as well as custom positioned labels
- Interactivity: Trackball, zoom, offset, mouse cursor change, mouse tooltips, and more
- Drill-Down capabilities: Extensive drill down support. A wide variety of events available
- Advanced 3D-view control: 360-degree rotation, viewer rotation, orthogonal and perspective projections, offset, and zoom, as well as many predefined projection schemes
- Advanced control over scene lighting: Several predefined lighting schemes. Up to 9 light sources. Spot and Directional light