
XtraCharts Suite
Visualize data and communicate cause and effect.
Published by DevExpress
Distributed by ComponentSource since 2001
Visualize data and communicate cause and effect.
Published by DevExpress
Distributed by ComponentSource since 2001

New licenses can only be purchased as part of DevExpress DXperience, DevExpress Universal or DevExpress WinForms
If you require information, please visit the pages above or Contact Us for pricing and availability.
XtraCharts is a comprehensive collection of 2D and 3D charts to address a broad range of business needs with ease. The Xtra Charts Suite has been engineered to dramatically simplify the way in which you visually present information to your end-users. Optimized for both performance and flexibility, the XtraCharts Suite is a highly customizable control library which can be leveraged in a nearly endless number of business scenarios, be it real-time charting or analysis of multi-dimensional data. The Suite ships with 37 2D chart views and 22 3D views.


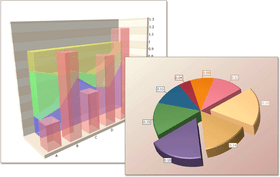
Image 1 / 6
Over 60 Chart Types
The Xtra Charts Suite helps you transform data to its most appropriate, concise and readable visual representation. To guarantee the highest levels of flexibility at both design and runtime, the Suite delivers dozens of 2D and 3D chart types - ranging from bars and doughnuts to line and financial views.
Flexible Data Binding, Intuitive Design Time Tools
Chart your data - regardless of its source. Like other DevExpress data...


XtraCharts Suite is also available in:
Live Chat with our DevExpress licensing specialists now.


Tel: (888) 850 9911
Fax: +1 770 250 6199


