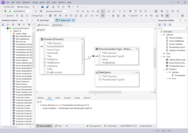
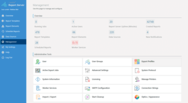
SQLyog Ultimate
Manage your MySQL databases with a GUI admin tool.
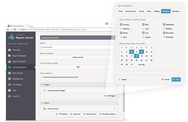
- Schedule backups, visually compare data and sync differences
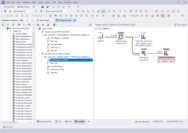
- Data transfer from any ODBC-compliant data source to MySQL
- SSH and HTTP Tunneling for Direct access to MySQL

Tel: (888) 850 9911
Fax: +1 770 250 6199