Data visualization components implement the functionality to view data in tables or data grids, as simple charts or complex graphs and enables you to create sophisticated management dashboards using gauges, maps and flowcharts.
Add interactive charts and maps to your apps and websites.
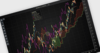
Responsive Stock Charts - Highcharts Stock's responsiveness goes beyond simply fitting the chart to the dimensions of its container. It also automatically finds an optimal placement for non-graph elements such as legends and headings.
Advanced data visualization for more informative reports.
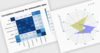
Nevron Map for SSRS - Provides report authors with an easy and powerful way to create choropleth and informative maps that are integrated with data. A perfect complement to any report that displays geographical data of any type.
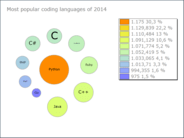
JavaScript charts programming library for all your data visualization needs.
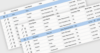
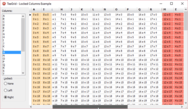
Threaded Rendering - Even with thousands of data points to crunch, the charts will not bring your browser to a crawl, thanks to the incremental data parsing/chart rendering system. While your chart is built, the whole page will remain responsive.
Create animated and interactive charts with thousands of data records.
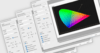
JavaScript API - The robust API allows you to leverage and interact with your charts autonomously and also allows for full extension of chart types and design. Easily add interactions with just a few lines of code.
A pure JavaScript library for creating responsive, interactive charts for React apps.
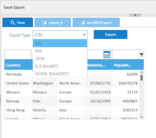
Export and Print Charts - With the exporting module enabled, your users can export their charts to PNG, JPG, PDF or SVG format at the click of a button, or print the chart directly from the Web page.
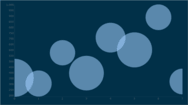
Every map type you need - Highcharts Maps includes a wide range of vector-based map types including map area, map line, points of interest, bubbles on maps and heatmaps.
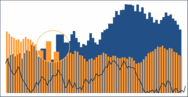
Create stock or general timeline charts for your Web and mobile apps.
Stock and Timeline Charts - Highcharts Stock provides a wide range of dynamic, responsive stock chart types and timelines which can be used to visualize the most complex data in an understandable, user-friendly format.
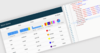
Includes over 600 UI Controls, DevExpress Dashboard, eXpressApp Framework and more.
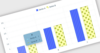
Data Visualization Widgets - JavaScript data visualization widgets allow you to transform data to its most concise and readable visual representation. All chart, gauge and range selector widgets can be composed into beautiful, informative dashboards that effectively convey intelligence at a single glance.
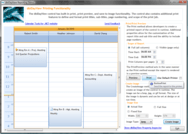
Add platform independent diagramming to your application.
Diagram Shapes - Over 100 predefined node shapes are available for you to choose from and you can also define your own. The connectors also provide a variety of customization options, they can be straight lines, curves, start and end with various arrowhead shapes, change color and position.