Data visualization components implement the functionality to view data in tables or data grids, as simple charts or complex graphs and enables you to create sophisticated management dashboards using gauges, maps and flowcharts.
Add interactive charts and maps to your apps and websites.
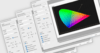
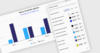
Responsive Stock Charts - Highcharts Stock's responsiveness goes beyond simply fitting the chart to the dimensions of its container. It also automatically finds an optimal placement for non-graph elements such as legends and headings.
Advanced data visualization for more informative reports.
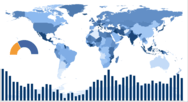
Nevron Map for SSRS - Provides report authors with an easy and powerful way to create choropleth and informative maps that are integrated with data. A perfect complement to any report that displays geographical data of any type.
Includes over 600 UI Controls, DevExpress Dashboard, eXpressApp Framework and more.
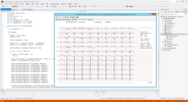
JavaScript Pivot Grid - A feature-rich client-side widget optimized for multi-dimensional data analysis. It ships with a rich set of runtime customization options so your users can quickly summarize business trends via its cross-tabular display format.
JavaScript charts designed to be embedded and integrated.
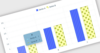
Wide Variety of Chart Types - AnyChart allows you to display 68 out-of-the-box chart types (Area, Bar, Bar Mekko, Box, Bubble, Bullet, Candlestick, Cherry, Circular, Column, Dot/Marker, Doughnut, etc.) and provides features to create your own.
.
Build responsive, interactive JavaScript data grids and tables.
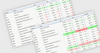
Aggregation - ZingGrid has default behaviors for calculating the average, count, min, max, and sum values for a given column. These aggregation values are displayed in a single row at the base of the grid.
JavaScript component suite for responsive Web development.
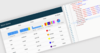
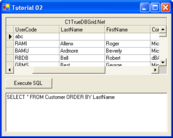
Data Grid - A feature-rich, data shaping and editing widget which allows end users to easily manage information and display it on-screen. The control supports binding to data from local arrays, JSON files, Web API and OData services, as well as custom remote services.
Sleek UI and tools for .NET and JavaScript technologies.
Build Native Mobile Apps - Telerik DevCraft UI includes 70+ controls to enable every developer to build professional-looking modern mobile applications for iOS, Android and UWP from a single code base.
Code once in C# and XAML across native mobile devices.
FlexGrid - Display tabular data across columns and rows with this powerful grid control. FlexGrid for Xamarin brings a spreadsheet-like experience to your apps, with intuitive touch gestures and quick-cell editing capabilities.