
ArtfulBits KPI Column
Add Key Performance Indicators (KPI) to your SharePoint systems.
Published by ArtfulBits
Distributed by ComponentSource since 2011
Prices from: US$ 245.00 Version: 2.1 Updated: May 16, 2017
Add Key Performance Indicators (KPI) to your SharePoint systems.
Published by ArtfulBits
Distributed by ComponentSource since 2011
Prices from: US$ 245.00 Version: 2.1 Updated: May 16, 2017

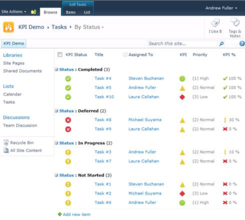
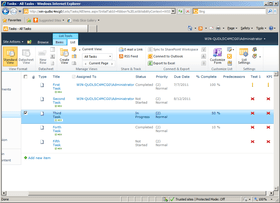
KPI Column provides SharePoint users with the ability to define and measure progress toward predefined goals and display current status by using easy-to-understand graphical indicators. The column automatically calculates the results and displays one of 3 indicators (OK, Warning or Problem).

KPI Column can be added to any custom list as a column and can use both List View and List Item as a data source. ArfulBits KPI Column also supports different indicator icons: flags, traffic lights, shapes, marks and others. You can use traffic light icons to indicate that predefined satisfaction is exceeding, meeting or failing to meet goals. If predefined satisfaction exceeds a preset goal, the KPI is displayed with a green traffic light icon. If satisfaction is failing to meet minimum goals...

ArtfulBits KPI Column is also available in:
Live Chat with our ArtfulBits licensing specialists now.
Tel: (888) 850 9911
Fax: +1 770 250 6199


