Screenshot Preview

ANTS Performance Profiler - Summary

by Red Gate Software - Product Type: Application / Developer Application

Summary

ANTS Performance Profiler by Red Gate Software

URLs: red-gate-ants-profiler, red gate ants profiler, redgateantsprofiler, red-gate, red gate, redgate

.NET code profiler. ANTS Performance Profiler is a tool for profiling applications written in any of the languages supported by the .NET framework. ANTS Performance Profiler profiles all .NET applications, including ASP.NET web applications, Windows Services and COM+ applications. ANTS Performance Profiler will identify performance bottlenecks within minutes, is fast and responsive with minimal impact on the execution of your program. It provides line-level timing so you can drill down to the specific lines of code responsible for performance inefficiencies. ANTS Performance Profiler is available as a standalone tool or as part of the Red Gate .NET Developer Bundle.

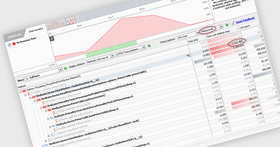
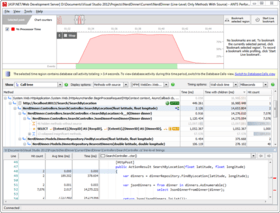
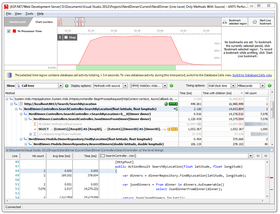
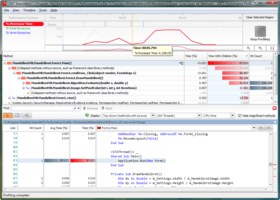
During performance profiling, ANTS Profiler records the time it takes for each line of code to be executed, as you are using your application. Detailed results then reveal the slowest lines of code and methods, allowing you to quickly identify performance bottlenecks and optimize your .NET application accordingly.

Identify performance bottlenecks within minutes

Fast and responsive – minimal impact on the execution of your program

Line-level timing – drill down to the specific lines of code responsible for performance inefficiencies

Profile any .NET application, including ASP.NET web applications

ANTS Profiler is available in two editions, Standard and Pro:

Key Features in both editions:

Supports .NET executable, Windows service, COM+ Server and ASP.NET web applications (including multi-threaded applications)

Line-level code timing

Timeline for viewing the profiling data just for a selected region of activity

Call Tree which auto-expands the worst performing stack traces

Features available in Pro edition only:

Call Graph view for visualizing all the callers and callees for a particular method

Method-level code timings (faster profiling modes)

Profiling child processes

Save profiler results

Find / filter functions

ANTS Performance Profiler Features:

Profile any .NET language. It doesn't matter whether you're programming in C#, VB.NET, managed C++, or in COBOL.NET. If you're programming for the .NET Framework, then ANTS Performance Profiler can help you.

Profile ASP.NET web applications so you can identify slow code in your .NET websites and web services. ANTS Performance Profiler will identify slow-loading pages and, more importantly, tell you why they are slow.

Profile Windows Forms applications so you can optimize rich, client-side applications.

Profile .NET 1.1, .NET 2.0, .NET 3.0 and .NET 3.5 applications – WCF (Indigo), WPF (Avalon), WF, XBAP.

Profile web applications on IIS 5, IIS 5.1, IIS 6, IIS 7, and ASP.NET Web Development Server (Cassini).

Support for 64-bit profiling on x64 processors.

Integration with Visual Studio 2005 and 2008, so you can start profiling your application from within your IDE. One click launches ANTS Performance Profiler within seconds, with the executable path already set.

Timeline for zeroing in on problem code; select a region of activity and view the data just for that region.

Call tree which auto-expands the worst performing stack traces.

Additional features available in ANTS Performance Profiler Pro only:

Method-level timings (faster profiling modes).

Profiling child processes.

Save and load profiler results.

Find/Filter functions.

Call graph for visualizing all the callers and callees for a particular method.

ANTS Performance Profiler 7.0.2 Release Notes

This release of ANTS Performance Profiler adds full support for profiling SharePoint 2010 sites, web applications running in IIS Express, and web applications deployed to Windows Azure or Amazon EC2.

The new integrated decompilation tool, using .NET Reflector technology, lets you decompile methods without source directly from the ANTS Performance Profiler interface. You can navigate decompiled source from third-party and framework assemblies as if it was your own code. If you have the PDB file, you can even view line-level timings for the decompiled code, letting you identify the exact code that caused the bottleneck.

The release also includes an early access version of the ANTS Performance Profiler continuous profiling tool, a new profiler mode under development at Red Gate. It's designed to log performance data on live, running ASP.NET applications. The tool logs method calls as they happen on your site, and stores results to display in a web interface: browse back through the timeline to see historical performance data, and analyze problems as they really occurred.

Watch your code execute while your site is used, with hit counts, timings, and CPU figures.

View real data captured while performance issues occurred: no need to stop your site, relaunch with a profiler, and guess at reproduction steps.

Access results directly in your web browser.

This early access build of continuous profiling features an automatic installer, a timeline showing CPU usage, and a call tree that lets you see the method calls executing during a selected period of your application’s execution.

Enhancements:

When using integrated decompilation, assemblies in .vb format are now decompiled to VB source code, rather than C#.

"File not found" exceptions when decompiling source code are now handled more gracefully.

Bug fixes

PP-1280: The profiler no longer uses isolated storage, working around a .NET framework bug in this mechanism.

PP-1846: Resolves an intermittent hang, associated with the error message "Tried to access an out of range method ID".

PP-1667: SharePoint subsites can now be selected from the URL dropdown list when setting up a SharePoint profiling session.

PP-1843: Web services hosted in IIS Express can now be profiled directly when setting up an IIS Express profiling session.

PP-1661: IIS subsites for SharePoint web services are now filtered out of SharePoint profiling dropdown.

ANTS Performance Profiler 6.2 Release Notes

This version removes a dependency on the Microsoft J# runtime, thereby making installation both quicker and more reliable. A number of other minor bug fixes are also included.

Please note that ANTS Performance Profiler 6.2 does not support SharePoint 2010 or Windows Phone 7.

ANTS Performance Profiler Standard 6.0 New Features:

New Silverlight 4 support

New Attach to a running process

ANTS Performance Profiler 5.2 is a bug fix release for ANTS Performance Profiler 5.x. Enhancements and fixes include:

Profiling of IIS child processes now works, which enables easier Sharepoint profiling

Fixed StackOverflowException when profiling Sharepoint

Thread affinity no longer depends upon whether or not inlining is enabled

Fixed performance issue with locating PDB files for source code view

Fixed problem with logging configuration which caused some levels to be ignored

No longer checks for updates on every start-up

This is a recommended upgrade for all users of ANTS Performance Profiler 5.x, particularly those working with Sharepoint.

.NET code profiler.

Pricing: ANTS Performance Profiler Standard 7.0.2 1 User License, ANTS Performance Profiler Standard 7.0.2 5 User License, ANTS Performance Profiler Standard 7.0.2 10 User License, ANTS Performance Profiler Standard 7.0.2 with 12 Months of Support and Upgrades 1 User License, ANTS Performance Profiler Standard 7.0.2 with 12 Months of Support and Upgrades 5 User License, ANTS Performance Profiler Standard 7.0.2 with 12 Months of Support and Upgrades 10 User License, ANTS Performance Profiler Standard 7.0.2 with 24 Months of Support and Upgrades 1 User License, ANTS Performance Profiler Standard 7.0.2 with 24 Months of Support and Upgrades 5 User License, ANTS Performance Profiler Standard 7.0.2 with 24 Months of Support and Upgrades 10 User License, ANTS Performance Profiler Standard 7.0.2 with 36 Months of Support and Upgrades 1 User License, ANTS Performance Profiler Standard 7.0.2 with 36 Months of Support and Upgrades 5 User License, ANTS Performance Profiler Standard 7.0.2 with 36 Months of Support and Upgrades 10 User License, ANTS Performance Profiler Standard 7.0.2 Renewal License - 12 Months of Support and Upgrades 1 User Renewal License, ANTS Performance Profiler Standard 7.0.2 Renewal License - 12 Months of Support and Upgrades 5 User Renewal License, ANTS Performance Profiler Standard 7.0.2 Renewal License - 12 Months of Support and Upgrades 10 User Renewal License, ANTS Performance Profiler Standard 7.0.2 Renewal License - 24 Months of Support and Upgrades 1 User Renewal License, ANTS Performance Profiler Standard 7.0.2 Renewal License - 24 Months of Support and Upgrades 5 User Renewal License, ANTS Performance Profiler Standard 7.0.2 Renewal License - 24 Months of Support and Upgrades 10 User Renewal License, ANTS Performance Profiler Standard 7.0.2 Renewal License - 36 Months of Support and Upgrades 1 User Renewal License, ANTS Performance Profiler Standard 7.0.2 Renewal License - 36 Months of Support and Upgrades 5 User Renewal License, ANTS Performance Profiler Standard 7.0.2 Renewal License - 36 Months of Support and Upgrades 10 User Renewal License

Evals & Downloads: Read the ANTS Performance Profiler help file, Read the ANTS Performance Profiler Data sheet, Read the ANTS Profiler End User License Agreement, Download the Red Gate .NET Developer Bundle evaluation on to your computer - Expires after 14 days

Operating System for Deployment: Windows 7, Windows Server 2008, Windows Vista, Windows XP, Windows Server 2003

Architecture of Product: 32Bit, 64Bit

Product Type: Application

Application Type: Developer Application

Built Using: .NET Framework 2.x

Compatible Containers: Microsoft Visual Studio 2008, Microsoft Visual Studio 2005, Microsoft Visual Basic 2008, Microsoft Visual Basic 2005, Microsoft Visual C++ 2008, Microsoft Visual C++ 2005, Microsoft Visual C# 2008, Microsoft Visual C# 2005, .NET Framework 4.0, .NET Framework 3.5, .NET Framework 3.0, .NET Framework 2.0, Silverlight 4

Keywords: ants performance profiler standard, ants performace std, performance profiler std, red gate ants std, redgate ants standard, red gate ants standard, buy ants performance std, ants performance standard

Red Gate Software Red-Gate RedGate

Debugging debug debugs Testing Test Tests

activex, com, com repair

Development

Part numbers: PC-516683-451246 516683-451246 PC-516683-451248 516683-451248 PC-516683-451250 516683-451250 PC-516683-451252 516683-451252 PC-516683-451254 516683-451254 PC-516683-451256 516683-451256 PC-516683-451258 516683-451258 PC-516683-451260 516683-451260 PC-516683-451262 516683-451262 PC-516683-451264 516683-451264 PC-516683-451266 516683-451266 PC-516683-451268 516683-451268 PC-516683-451270 516683-451270 PC-516683-451272 516683-451272 PC-516683-451274 516683-451274 PC-516683-451276 516683-451276 PC-516683-451278 516683-451278 PC-516683-451280 516683-451280 PC-516683-451282 516683-451282 PC-516683-451284 516683-451284 PC-516683-451286 516683-451286

Mfr. Part No: P7U10M0 P7U10M12 P7U10M24 P7U10M36 P7U1M0 P7U1M12 P7U1M24 P7U1M36 P7U5M0 P7U5M12 P7U5M24 P7U5M36

Product Search

Enter search words:

Award