查看所有元件類別
查看所有的元件類型
查看所有的元件環境
查看所有的元件開發原廠
看到所有的應用程式類別
看到所有的應用程式類型
看到所有的應用程式開發原廠
查看所有Add-in 類別
看到所有Add-in 的出版商
看到所有品牌
查看所有分類新聞
查看所有結構新聞
查看所有新聞
DevExpress
Highsoft
Aspose
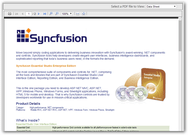
Syncfusion
Telerik
MESCIUS (formerly GrapeCity)
Iron Software
Dart Communications
Steema Software
Devart
combit
Rebex
DBI Technologies
功能焦點
Aspose.Slides for .NET - 能讓任何.NET 應用程式讀取、寫入、修改和轉換 PowerPoint 文件,而無需使用 Microsoft PowerPoint。它能將演示文稿幻燈片呈現到 PDF、XPS、HTML、圖像和 PDF 注釋。.
WinUI 報表 - 您可以使用整合的報表和資料源精靈、對資料進行分組和排序、將報表控制項/字段拖放到報表設計圖面上、當地語系化報表、處理事件和預覽報表。.
報表設計器 - 包括一個強大的報表設計器,用於處理您應用程式中的報表,以及作為可用來創建和修改報表的獨立應用程式使用。 此應用程式已為 Microsoft Windows 和 macOS 提供。.
輕鬆構建現代 Web 應用 - Kendo UI 提供在緊迫的截止時間內構建現代 Web 應用程式所需的一切,具有開箱即用的特性和功能,可將您的開發時間加快 50%。.
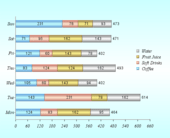
互動式圖表和圖表 - 透过從線條到財務圖表的30多個圖表和圖形視覺化和分析資料。使用者可以與縮放和平移、選擇、工具提示和軌跡球等功能進行交互並用其進行探索。.
雲郵件庫 - 使用流行的雲服務發送、接收和管理郵件,如 Microsoft 365 (Outlook)、Amazon SES 和 GMail。 還支援新式身份驗證和安全選項,包括 OAuth、TLS 1.3 和 TLS 1.2。.
導入/匯出 Excel 檔 - 沒有對 Microsoft Excel 導入/匯出的完全支援,任何試算表都不完整。導入您最先進的 Excel 試算表,然後將您的 Spread.NET 試算表匯出到 XLSX 或其它檔案格式,所有都無需依賴 Excel。.
語法突出顯示 - 用 SyntaxEditor 包括了 100 多項編輯操作,涵蓋從基本的插入符號移動和選擇到諸如 tabification、字符/單字/線轉置等功能。.
多媒體轉換 SDK - 利用 DirectShow 和 Media Foundation 將音訊和視訊轉換功能添加到 .NET (C# & VB) 和 C/C++ 應用程式中,以滿足存檔、互聯網串流和移動相容性等要求。.
靈活的 JavaScript 圖表控制項 - 適用於企業應用程式的 80 多種快速、靈活的 JavaScript 圖表. 包括數十個圖表元素、靈活的資料綁定和圖元完美的 SVG 呈現和圖像匯出.