
Nevron Chart for SharePoint
为 SharePoint 环境提供先进的图表解决方案。
由以下开发商制作:Nevron
ComponentSource开始代理销售的日期:1999年
为 SharePoint 环境提供先进的图表解决方案。
由以下开发商制作:Nevron
ComponentSource开始代理销售的日期:1999年

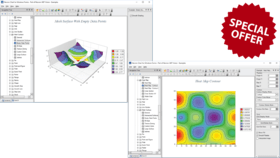
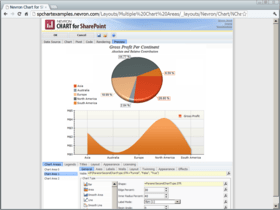
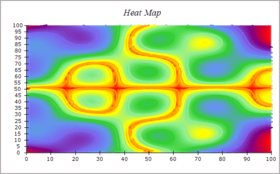
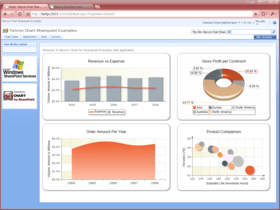
Nevron Chart for SharePoint is an advanced chart web part, which delivers a complete set of 2D and 3D charting types, highly customizable axes, advanced data analysis features, tight data integration and visual effects to your SharePoint sites. It combines the Nevron Charting engine for ASP.NET together with the elegant Nevron Pivot Data Aggregation engine. This allows Nevron Chart for SharePoint users to create complex pivot charts visually and directly in the SharePoint environment.


图像1/6
Nevron Chart for SharePoint features:
Supported Charting Types
Bar Charts (Horizontal and Vertical) - available in 2D and 3D
The Chart Web Part Bar & Column Chart type displays a sequence of horizontal or vertical bars (shapes) of lengths proportional to the value that they...


透过Live Chat与我们的Nevron 专家联络!


联系电话: (888) 850 9911
传真: +1 770 250 6199


