Añada gráficos de velas a sus aplicaciones WinForms
Los gráficos de velas capturan visualmente la evolución del precio, la apertura/cierre y los máximos/mínimos, revelando el sentimiento del mercado y oportunidades de trading.
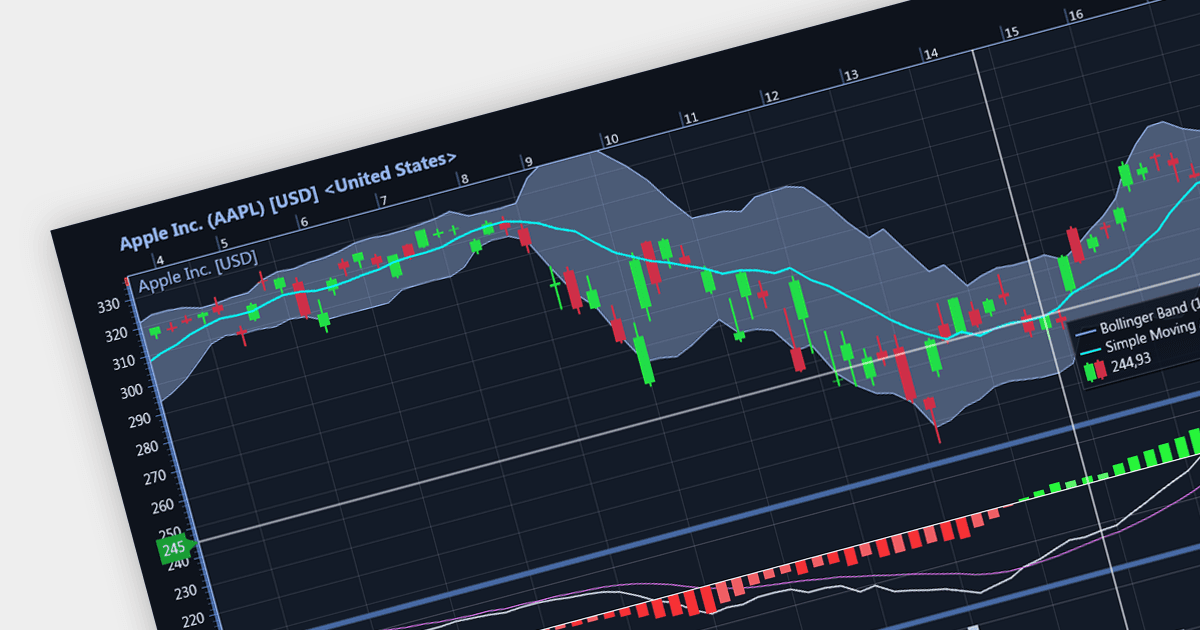
Los gráficos de velas (candlestick) son un tipo de gráfico financiero que se usa para describir los movimientos de precio de un valor, un derivado o una divisa. Cada "vela" suele mostrar un día, con el "cuadro" central que representa el rango entre los precios de apertura y cierre, y las líneas que muestran los máximos y mínimos. Su formato visual único ayuda a los traders a comprender rápidamente el sentimiento del mercado.
Varios controles de gráficos de WinForms ofrecen gráficos de velas, incluyendo:
- DevExpress WinForms Chart (parte de DevExpress WinForms) proporciona un control de precisión sobre cada aspecto de las velas, desde las sombras hasta las mechas (wicks), ideal para el análisis técnico.
- ComponentOne Charts for WinForms (parte de ComponentOne Studio WinForms) incluye plantillas de velas incorporadas e indicadores financieros que aceleran el análisis del mercado.
- Telerik Windows Forms ChartView (parte de Telerik UI for WinForms) ofrece un renderizado de velas optimizado con zoom/desplazamiento (panning) fluido, ideal para plataformas de trading dinámicas.
- Syncfusion WinForms Chart (parte de Syncfusion Essential Studio Enterprise) ofrece amplias opciones de personalización que le permiten adaptar las velas a sus necesidades de trading.
- LightningChart .NET proporciona actualizaciones rápidas de velas que le mantienen por delante del mercado, perfecto para paneles de trading en tiempo real.
Para un análisis en profundidad de características y precio, visite nuestra comparación de controles de gráficos de WinForms.