Muestra el progreso con bullet charts orientados a objetivos
Compara los valores de presupuesto, previsión y real en un bullet chart compacto para detectar al instante las desviaciones y seguir el progreso hacia los objetivos con claridad.
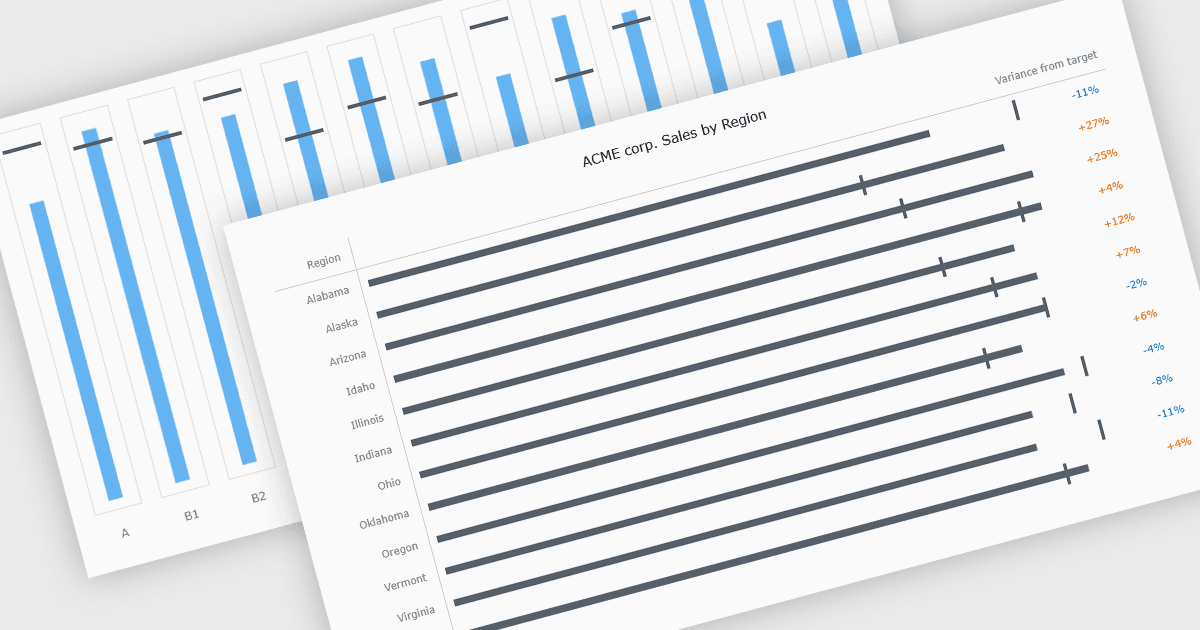
Los gráficos de viñetas (bullet charts) son visualizaciones orientadas a objetivos que comparan el rendimiento real con metas y puntos de referencia, como valores de presupuesto y previsión, en una vista única, fácil de leer. Ofrecen una alternativa clara a los indicadores y medidores al mostrar el progreso hacia los objetivos, haciendo que las desviaciones y los déficits sean inmediatamente evidentes. Al presentar varios puntos de referencia juntos, los bullet charts ayudan a las partes interesadas a interpretar el rendimiento de forma rápida y coherente en distintos indicadores. Los casos de uso más comunes incluyen informes financieros, seguimiento de ventas y márgenes, paneles de KPI, cuadros de mando operativos y resúmenes ejecutivos, donde las comparaciones rápidas y fiables respaldan una mejor toma de decisiones.
Varios controles de gráficos de JavaScript ofrecen compatibilidad con bullet charts, incluyendo:
- Highcharts Core de Highsoft te permite crear bullet charts para comparar el rendimiento con objetivos, con sugerencias interactivas, diseños responsivos y opciones de personalización.
- KendoReact Charts (parte de KendoReact de Telerik) permite renderizar bullet charts, destacando los KPI, rangos cualitativos y componentes accesibles.
- amCharts 5: Charts facilita bullet charts modernos con transiciones animadas, ejes flexibles, referencias precisas y tematización para aplicaciones de paneles basados en datos.
- Syncfusion JavaScript Charts (parte de Syncfusion Essential Studio Enterprise) te permite crear bullet charts que muestran objetivos, rangos y valores reales.
Para un análisis en profundidad de las características y el precio, visita nuestra comparación de controles de bullet chart de JavaScript.