Resalte tendencias con gráficos de mapa de calor
Utilice la representación de datos basada en colores para revelar patrones y anomalías en conjuntos de datos de estilo matricial dentro de un componente de gráfico.
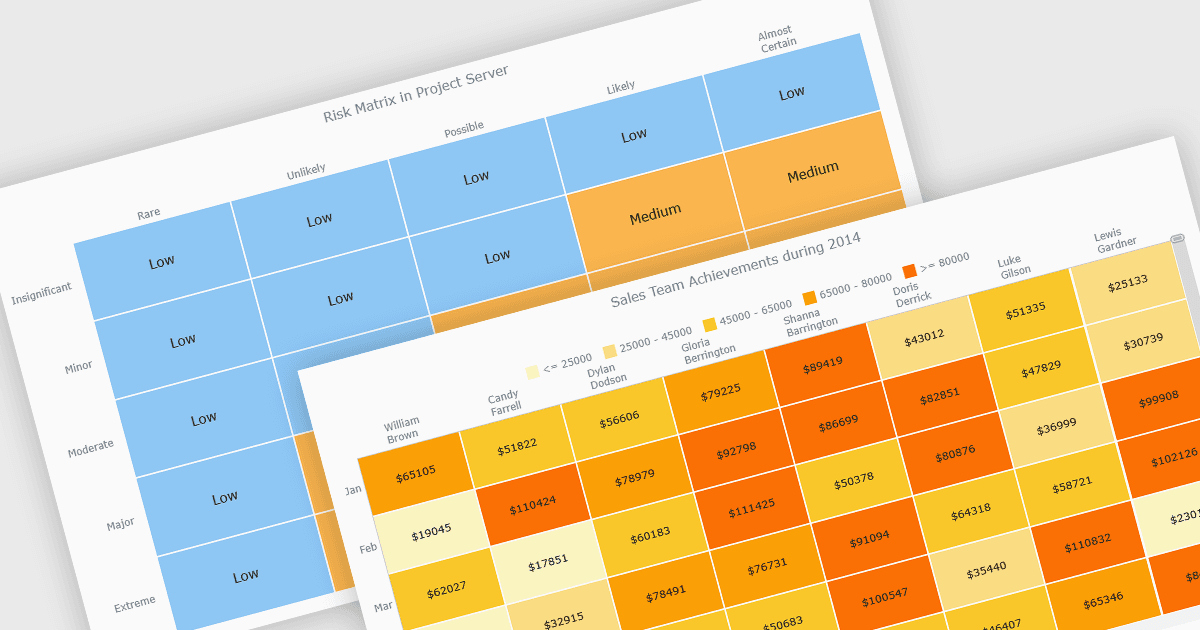
Un mapa de calor es una visualización de datos que muestra valores en una cuadrícula de celdas coloreadas, donde la intensidad del color representa la magnitud o importancia de los datos. Este enfoque facilita identificar rápidamente patrones, tendencias y valores atípicos que pueden ser difíciles de ver en las tablas tradicionales. Los mapas de calor mejoran el análisis de datos al resaltar visualmente las relaciones entre dos variables y permitir comparaciones rápidas entre conjuntos de datos. Se utilizan comúnmente en matrices de riesgo, supervisión del rendimiento, análisis de ventas y seguimiento del comportamiento de los usuarios, donde los conocimientos codificados por colores ayudan a los usuarios a centrarse en la información más significativa.
Varios controles de gráficos de JavaScript admiten los tipos de gráficos de mapa de calor, incluidos:
- Highcharts Core de Highsoft le permite crear mapas de calor interactivos que visualizan datos matriciales con valores codificados por colores, revelando patrones, tendencias y comparaciones entre categorías.
- LightningChart JS permite representar mapas de calor de alto rendimiento para grandes conjuntos de datos, utilizando aceleración GPU para revelar patrones, intensidades y correlaciones en tiempo real.
- AnyChart JS facilita la creación de mapas de calor personalizables que transforman datos tabulares en cuadrículas codificadas por colores, ayudando a los usuarios a detectar tendencias, correlaciones y distribución de datos.
- JSCharting le permite crear mapas de calor interactivos que resaltan la intensidad de los valores mediante rangos de color, lo que permite una comparación rápida, el descubrimiento de patrones y un análisis intuitivo.
Para un análisis en profundidad de las características y el precio, visite nuestra comparación de controles de gráficos de JavaScript.