Visualiza Datos Complejos con Gráficos Dinámicos
Crea gráficos dinámicos interactivos para visualizar datos resumidos, descubrir tendencias y apoyar un análisis de datos efectivo.
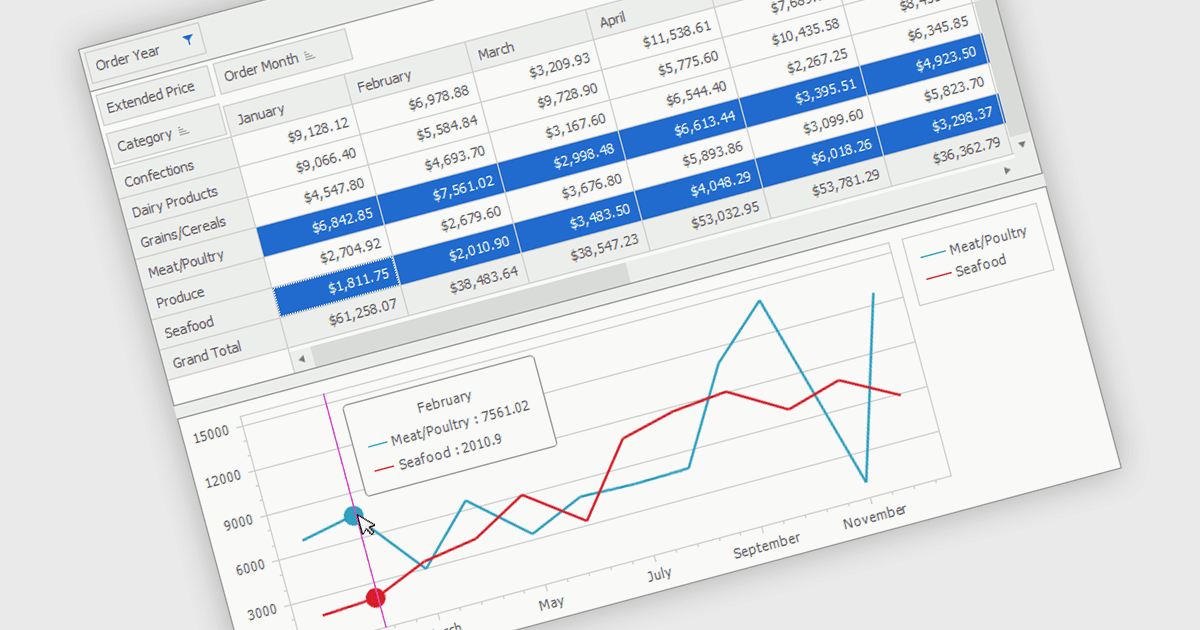
Un gráfico dinámico es una herramienta de visualización de datos interactiva que funciona junto con una tabla dinámica para mostrar datos resumidos en formato gráfico. Permite a los usuarios analizar conjuntos de datos cambiando dinámicamente categorías, series y filtros sin alterar los datos de origen. Al presentar tendencias, comparaciones y patrones visualmente, los gráficos dinámicos facilitan la interpretación de información compleja y apoyan una toma de decisiones más rápida. Se utilizan ampliamente en inteligencia empresarial, informes y análisis de datos donde la exploración flexible de datos agregados es importante.
Varias suites de UI .NET WinForms te ofrecen funcionalidad de gráficos dinámicos, incluyendo:
- DevExpress WinForms te permite crear gráficos dinámicos interactivos que visualizan resúmenes de Pivot Grid, revelan tendencias y simplifican el análisis multidimensional de datos.
- ComponentOne Studio WinForms de MESCIUS permite crear gráficos dinámicos a partir de datos resumidos para un análisis de tendencias y reportes más claros.
- Syncfusion Essential Studio UI Component Suite facilita gráficos dinámicos interactivos que transforman los resúmenes de Pivot Table en conocimientos visuales para un análisis empresarial eficiente.
Para un análisis detallado de características y precios, visita nuestra comparación de suites UI .NET WinForms.