
TeeChart Pro ActiveX
Cree soluciones de paneles de control y gráficos de alto rendimiento.
Publicado por Steema Software
Distribuido por ComponentSource desde 1998
Precios desde: $ 505.68 Versión: 2026.x Actualizado: Apr 1, 2026 ![]()
![]()
![]()
![]()
![]() (2)
(2)
Cree soluciones de paneles de control y gráficos de alto rendimiento.
Publicado por Steema Software
Distribuido por ComponentSource desde 1998
Precios desde: $ 505.68 Versión: 2026.x Actualizado: Apr 1, 2026 ![]()
![]()
![]()
![]()
![]() (2)
(2)

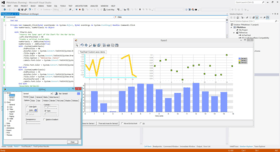
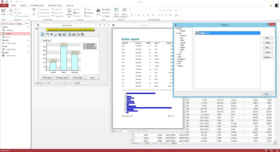
TeeChart Pro ActiveX is a charting control for ActiveX aware programming environments such as Microsoft Office, Visual Studio's VB, VC++ and ASP, including Visual Studio.NET (VB.NET, C#). It includes advanced features like the ability to create a Windows AVI standard video file from a Chart, playing videos (AVI, MPEG, DivX etc) inside a Chart background, automatic map drawing, IsoSurface series for drawing a 3D surface mesh from a grid of XYZ points and many more. TeeChart ActiveX offers 25 editor languages and is Unicode compliant for multi-characterset support, including double-byte languages, for true global application development. TeeChart ActiveX renders in most popular Graphics formats including JPEG, PNG and WMF/EMF. TeeChart ActiveX also includes Gauges and Maps that can be used to create multi-task dashboards.


Imagen 1 / 33
The TeeChart Pro ActiveX charting component library offers hundreds of Graph styles in 2D and 3D, 56 mathematical and statistical Functions for you to choose from together with an unlimited number of axes and 14 toolbox components. The Charting Control can be efficiently used to create multi task dashboards.
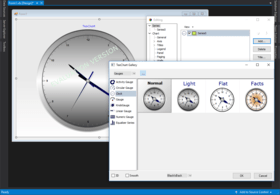
Plug-in Versatility


Chatee en vivo ahora mismo con nuestros especialistas en licencias de Steema Software.


Tel: (888) 850 9911
Fax: +1 770 250 6199


