Aggiungi grafici a candele alle tue app WinForms
I grafici a candele catturano visivamente la variazione di prezzo, l’apertura/chiusura e i massimi/minimi, rivelando il sentiment del mercato e le opportunità di trading.
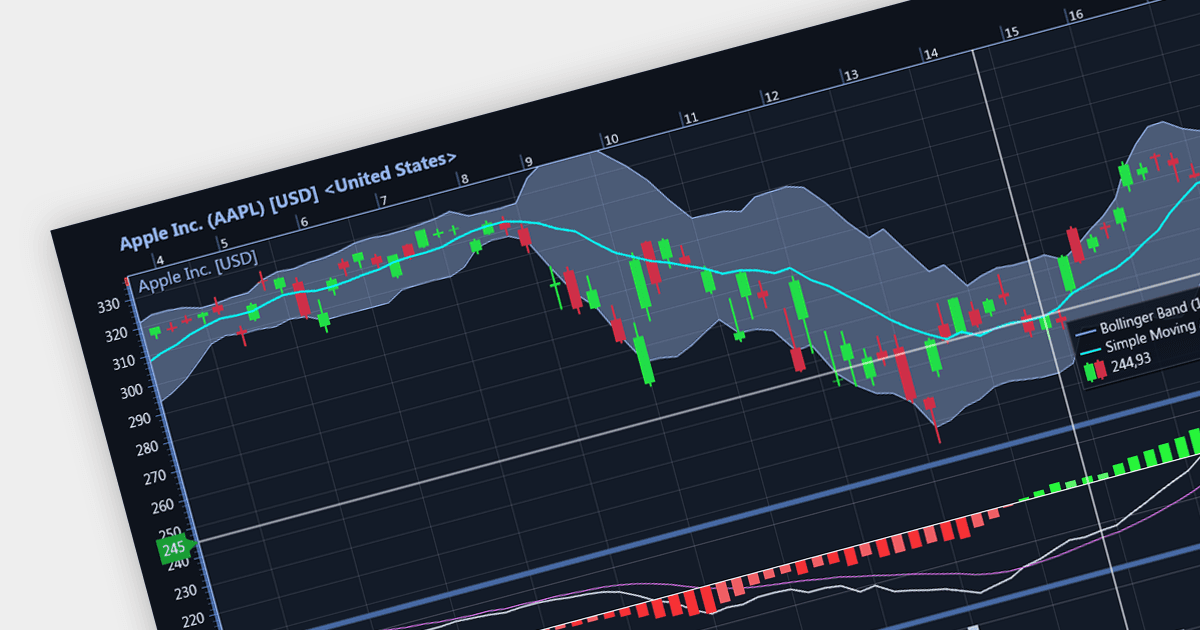
I grafici a candele sono un tipo di grafico finanziario usato per descrivere i movimenti di prezzo di un titolo, di un derivato o di una valuta. Ogni "candela" in genere mostra un giorno, con la "scatola" centrale che rappresenta l’intervallo tra i prezzi di apertura e quelli di chiusura e le linee che indicano i massimi e i minimi. Il loro formato visivo distintivo aiuta i trader a comprendere rapidamente il sentiment del mercato.
Diversi controlli chart per WinForms offrono grafici a candele, tra cui:
- DevExpress WinForms Chart (parte di DevExpress WinForms) fornisce un controllo di precisione su ogni aspetto delle candele, dalle ombre alle wicks, ideale per l’analisi tecnica.
- ComponentOne Charts for WinForms (parte di ComponentOne Studio WinForms) include template di candele predefiniti e indicatori finanziari integrati che accelerano l’analisi del mercato.
- Telerik Windows Forms ChartView (parte di Telerik UI for WinForms) offre il rendering delle candele in modo semplificato, con zoom/panning fluidi, ideale per piattaforme di trading dinamiche.
- Syncfusion WinForms Chart (parte di Syncfusion Essential Studio Enterprise) offre opzioni di personalizzazione estese che ti permettono di adattare le candele alle tue esigenze di trading.
- LightningChart .NET fornisce aggiornamenti rapidi delle candele che ti tengono un passo avanti rispetto al mercato, perfetto per dashboard di trading in tempo reale.
Per un’analisi approfondita delle funzionalità e del prezzo, visita la nostra comparazione dei controlli chart per WinForms.