Raggiungi più utenti con design di grafici accessibili
I grafici ad alto contrasto migliorano l’accessibilità, potenziando la comprensione e l’inclusività in report, dashboard e presentazioni.
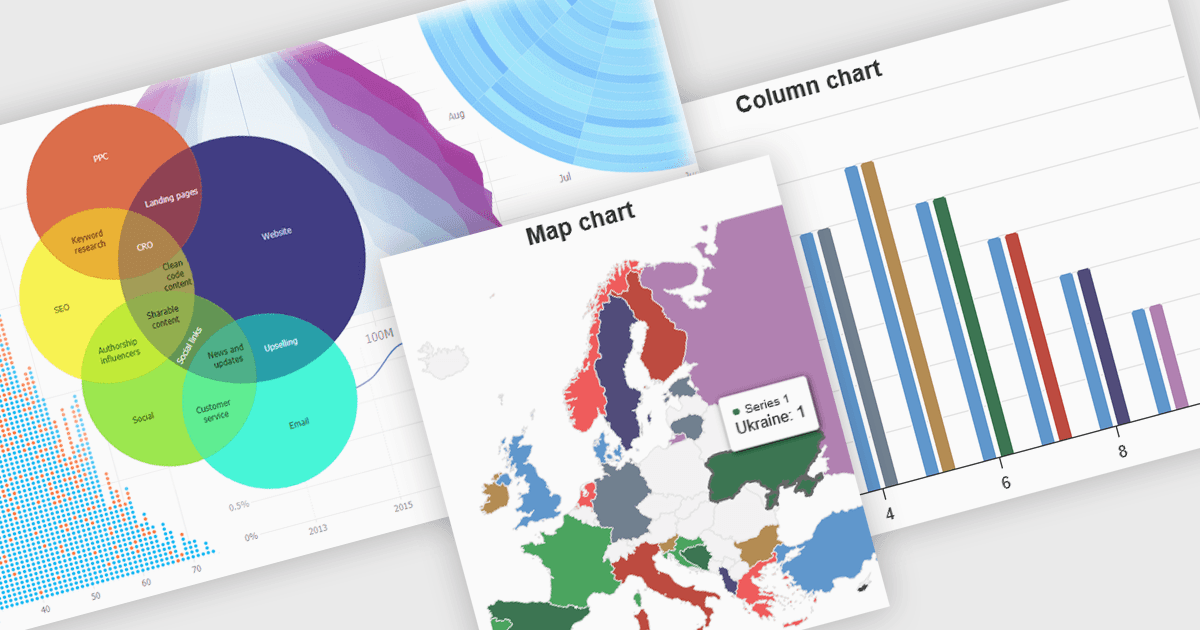
I grafici ad alto contrasto utilizzano palette di colori distinte e in forte contrasto all’interno delle visualizzazioni dei dati per migliorarne la chiarezza, in particolare per le persone con disabilità visive. Ciò implica la scelta di colori con tinte e luminosità sensibilmente diverse per elementi come linee, barre, etichette e sfondi, in modo che le differenze nei dati siano facili da individuare. Questi grafici migliorano la comprensione dei dati, rendono le informazioni accessibili a più persone, riducono l’affaticamento visivo per alcuni utenti e supportano gli standard di accessibilità. Sono utili in molte aree, come report finanziari, articoli scientifici e dashboard di sanità pubblica che devono essere chiari e progettati per un tutti, indipendentemente dall’abilità visiva.
Diverse componenti di grafici JavaScript offrono funzionalità di alto contrasto accessibili, tra cui:
- JSCharting esegue grafici ad alto contrasto accessibili, migliorando la chiarezza dei dati e l’inclusività per gli utenti con disabilità visive in applicazioni diverse.
- SmartClient Chart di Isomorphic Software offre temi ad alto contrasto integrati, garantendo che gli utenti con disabilità visive possano interpretare efficacemente dati aziendali complessi.
- jQWidgets Chart consente la creazione di visualizzazioni dei dati ad alto contrasto, migliorando la comprensione e l’accessibilità per un pubblico più ampio nelle applicazioni web.
- Highcharts Core di Highsoft facilita l’implementazione di grafici ad alto contrasto personalizzabili, promuovendo l’inclusività nella rappresentazione dei dati per tutti gli utenti.
Per un’analisi approfondita delle funzionalità e dei prezzi, visita il nostro confronto tra componenti di grafici JavaScript.