Visualizza le tendenze nel tempo con i grafici a linee
I grafici a linee offrono una visuale della progressione delle metriche, consentendo confronti tra più serie, l’identificazione di cambiamenti e la previsione strategica.
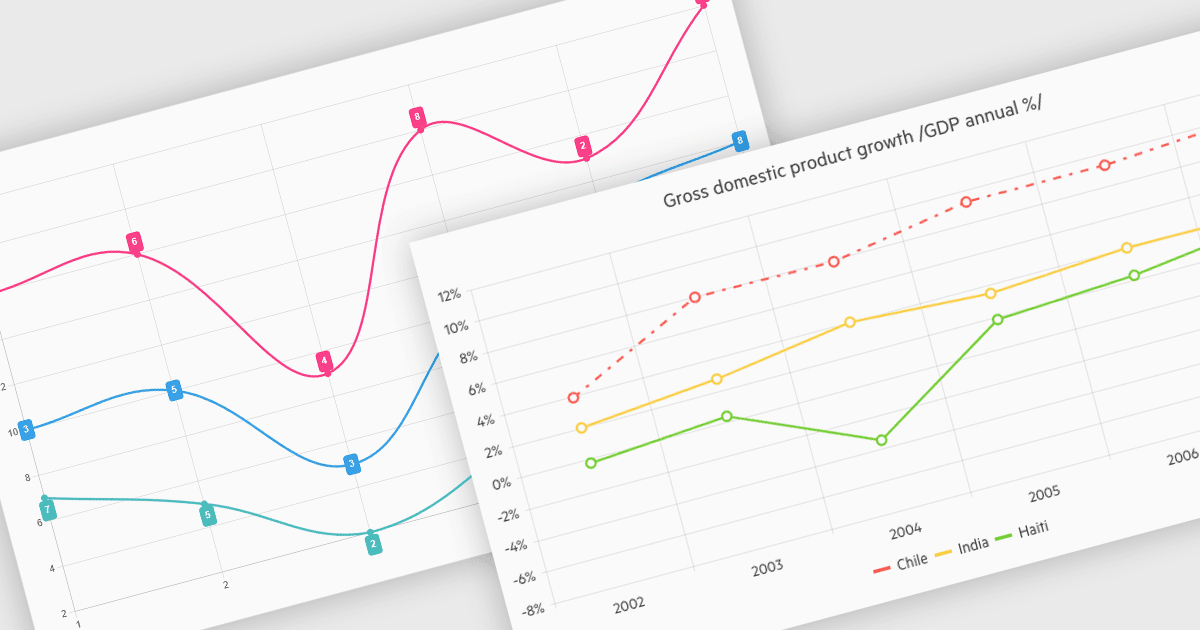
I grafici a linee collegano i punti di dati con linee per mostrare come variano i valori su una scala continua, di solito il tempo. Rendono facile individuare tendenze di lungo periodo, pattern stagionali e cambiamenti improvvisi mentre si confrontano più serie sulle stesse assi. Le applicazioni più comuni includono il monitoraggio dei prezzi delle azioni, la verifica del traffico del sito web, l’analisi dei dati climatici e il confronto delle vendite regionali per guidare la strategia aziendale. Mettendo in evidenza la progressione e le anomalie senza ingombrare, i grafici a linee aiutano a trasformare numeri grezzi in informazioni chiare e utilizzabili.
Diversi Controlli Grafico .NET Blazor offrono supporto per i grafici a linee, tra cui:
- Blazorise Chart consente di creare grafici a linee personalizzabili con animazioni fluide, tooltip, zoom e layout reattivi per app real-time ad alte prestazioni.
- TeeChart Blazor di Steema Software permette di eseguire il rendering di grafici a linee ad alte prestazioni con più serie, stili, controlli interattivi di pan e zoom ed esportazione.
- Infragistics Blazor Charts (parte di Infragistics Ignite UI) facilita la creazione di grafici a linee reattivi con stili, personalizzazione degli assi, aggiornamenti in tempo reale, marker dei dati e tooltip.
- DevExpress Blazor Chart (parte di DevExpress ASP.NET e Blazor) consente agli sviluppatori di creare grafici a linee interattivi con zoom e legende personalizzabili.
Per un’analisi approfondita delle funzionalità e dei prezzi, visita il nostro confronto dei Controlli Grafico .NET Blazor.