Illustra le tendenze di mercato con precisione visiva
I controlli dei grafici JavaScript con grafici Kagi riducono il rumore, mettono in evidenza le rotture e rivelano le tendenze di offerta e domanda nelle dinamiche di mercato.
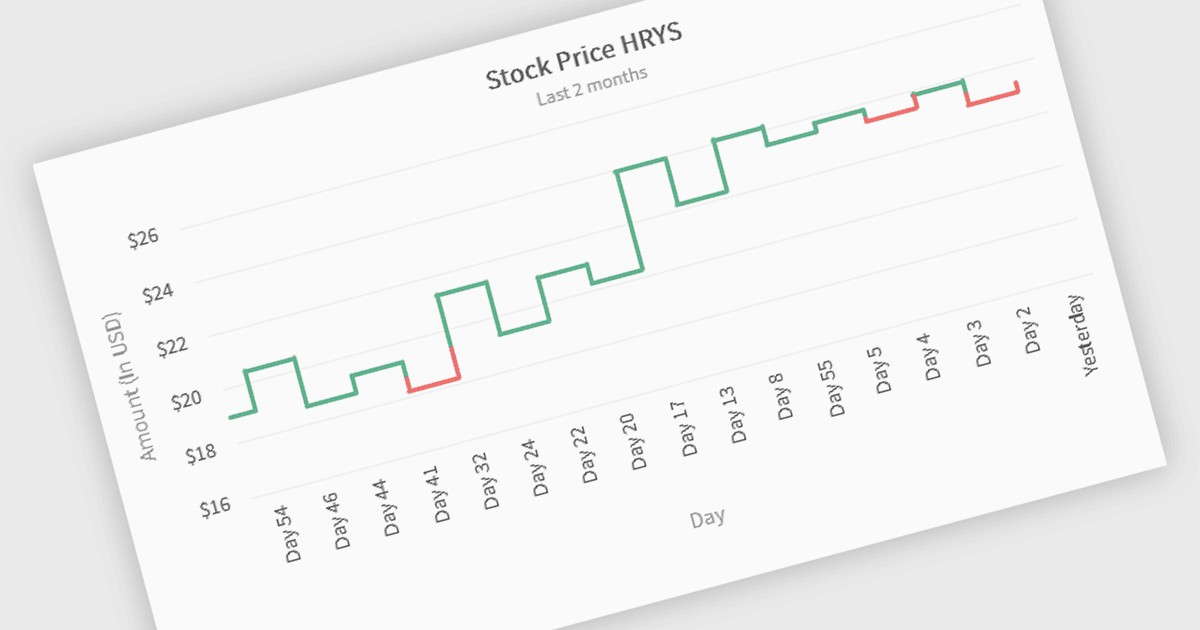
I grafici Kagi sono uno strumento di analisi tecnica che visualizza la variazione del prezzo tramite linee verticali, ignorando il fattore tempo per concentrarsi sui cambiamenti di prezzo più significativi. Le linee spesse indicano una domanda in aumento quando i prezzi superano i massimi precedenti, mentre le linee sottili segnalano un aumento dell’offerta quando i prezzi scendono al di sotto dei minimi precedenti. Questo formato visivo chiaro aiuta i trader a filtrare il rumore, individuare le tendenze e identificare rotture o inversioni fondamentali. Ideali per analizzare il sentiment del mercato, i grafici Kagi sono utilizzati su azioni, forex e materie prime per supportare decisioni di trading sicure e basate sui dati.
Diversi componenti di grafici JavaScript offrono grafici Kagi, tra cui:
- Wijmo FlexChart (parte di Wijmo by MESCIUS) ti consente di interpretare le dinamiche del prezzo utilizzando i grafici Kagi, filtrando il rumore per evidenziare segnali di trading e sentiment più chiari.
- FusionCharts Suite XT consente il rendering dei grafici Kagi per evidenziare rotture e inversioni del prezzo, migliorando la chiarezza nelle visualizzazioni di mercato basate sulle tendenze.
- LightningChart JS Trader ti permette di visualizzare gli spostamenti tra offerta e domanda con grafici Kagi per analisi finanziarie ad alte prestazioni e in tempo reale.
Per un’analisi approfondita di funzionalità e prezzo, visita il nostro confronto tra grafici JavaScript.