Visualizza i dati di mercato con i grafici OHLC in .NET
Arricchisci le app finanziarie con un’elevata performance nella visualizzazione dei dati usando i grafici OHLC (Open-High-Low-Close) per mostrare le variazioni di prezzo nel tempo.
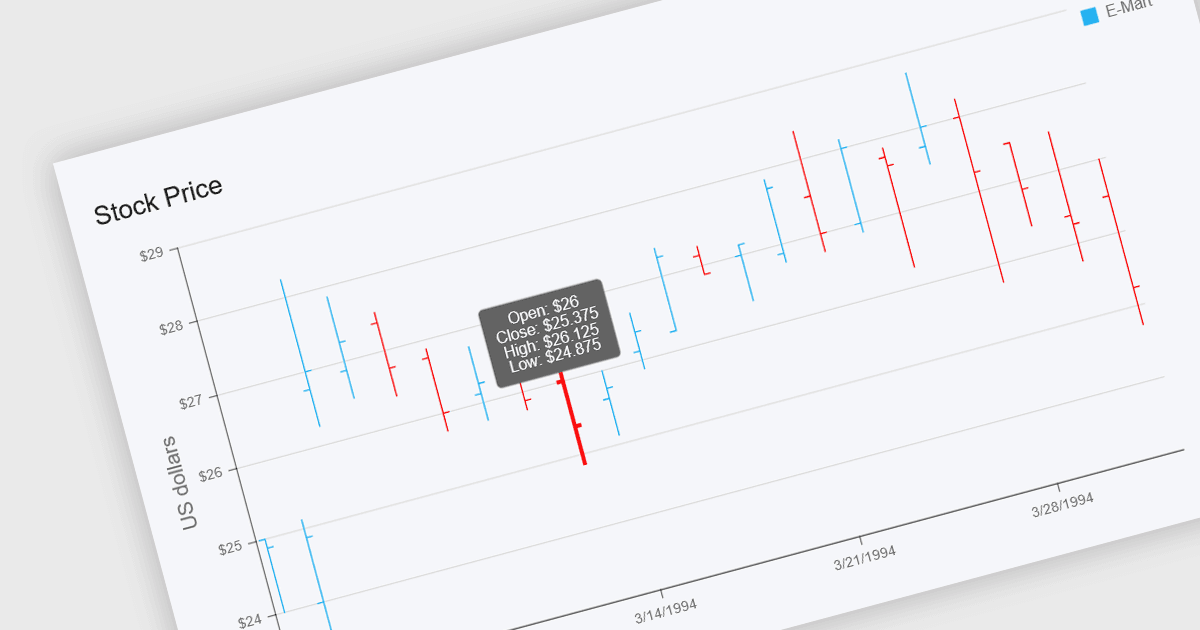
I grafici OHLC, abbreviati da Open-High-Low-Close (Apertura-Massimo-Minimo-Chiusura), sono un tipo di grafico finanziario utilizzato per rappresentare le variazioni di prezzo di un asset in un determinato periodo di tempo. Ogni punto del grafico riassume i prezzi di apertura, massimo, minimo e chiusura di un singolo intervallo, in genere visualizzati con barre verticali con tacche per indicare i valori di apertura e chiusura. Questo formato offre un modo chiaro e compatto per visualizzare la volatilità e le tendenze del mercato entro un dato arco temporale. Per sviluppatori e analisti che lavorano con dati finanziari, i grafici OHLC sono particolarmente utili per identificare pattern di prezzo, monitorare il comportamento del mercato e prendere decisioni informate basandosi sulle prestazioni storiche.
Diversi componenti per grafici .NET offrono grafici OHLC, tra cui:
- DevExpress ASP.NET Core Charts (parte di DevExpress ASP.NET e Blazor) ti permette di eseguire il rendering di grafici OHLC con tooltip e design responsive per un’analisi finanziaria in tempo reale.
- ComponentOne WinForms Charts (parte di ComponentOne Studio WinForms by MESCIUS) consente di tracciare dati OHLC per una visualizzazione accurata delle tendenze del mercato nelle app desktop.
- Telerik UI for WPF ChartView (parte di Telerik UI for WPF) supporta il rendering di grafici OHLC ad alte prestazioni con assi flessibili e opzioni di stile per dashboard finanziarie desktop.
- Syncfusion .NET MAUI Charts (parte di Syncfusion Essential Studio Enterprise) consente agli sviluppatori di creare app mobili multipiattaforma con grafici OHLC interattivi e animati.
Per un’analisi approfondita di funzionalità e prezzi, visita il nostro confronto tra componenti per grafici .NET.