Scopri gli insight con lo zoom interattivo dei grafici
Esamina più da vicino i punti dati critici, riducendo la complessità visiva e abilitando un'analisi accurata delle tendenze anche tra i set di dati più complessi.
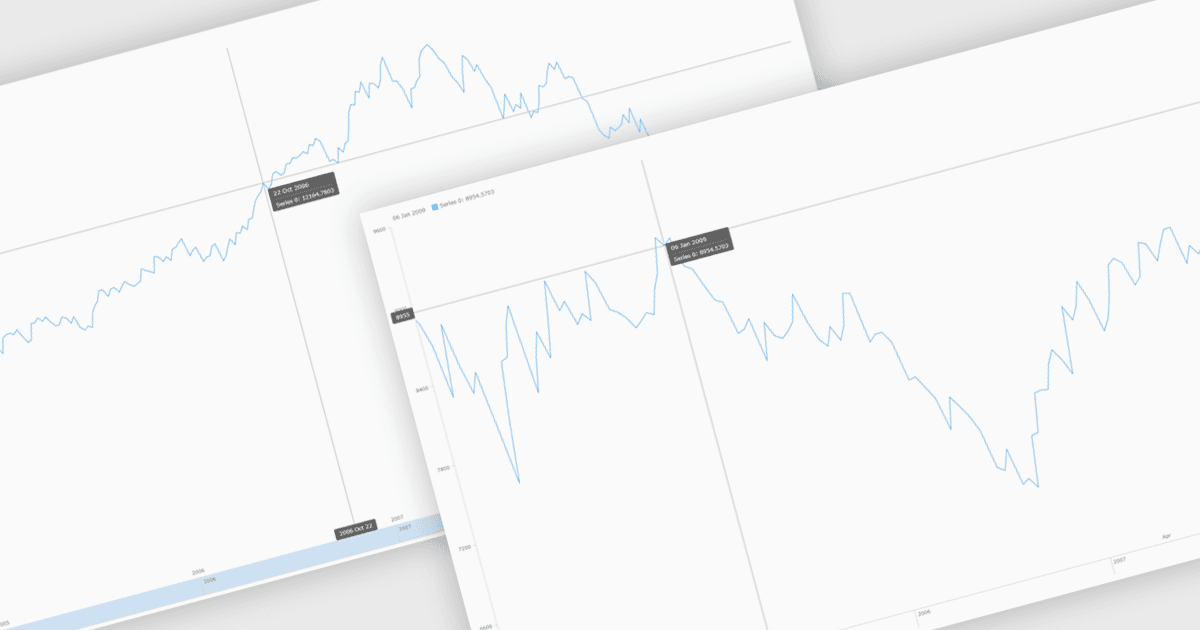
Lo zoom del grafico consente agli utenti di regolare in modo interattivo l'intervallo visualizzato di un grafico per concentrarsi su specifici punti dati, periodi di tempo o intervalli di valori, così da effettuare un'analisi più approfondita. Consentendo agli utenti di effettuare lo zoom avanti e indietro in modo dinamico, riduce il disordine visivo, migliora la chiarezza e aiuta a individuare tendenze, anomalie o modelli che potrebbero essere difficili da riconoscere in una visualizzazione a scala completa. Questa funzionalità interattiva supporta un processo decisionale più rapido e informato, permettendo di passare da panoramiche di alto livello a insight dettagliati senza dover ricaricare i dati. I casi d'uso più comuni includono l'analisi delle performance finanziarie su intervalli di tempo specifici, l'indagine di picchi o cali delle metriche operative, la revisione di dati dettagliati di sensori o monitoraggio e l'evidenziazione di segmenti chiave dei dati durante presentazioni o revisioni con gli stakeholder.
Diversi controlli di grafici JavaScript supportano lo zoom, tra cui:
- Highcharts Core ti consente di eseguire lo zoom in modo interattivo sui grafici per esplorare set di dati complessi, isolare intervalli temporali e analizzare le tendenze con controlli reattivi.
- KendoReact Charts (parte di KendoReact by Telerik) permette di eseguire lo zoom in modo preciso, aiutando le applicazioni a fornire insight più chiari grazie a un'esplorazione mirata dei dati.
- AnyChart JS facilita lo zoom del grafico in modo intuitivo, consentendo agli utenti di esaminare segmenti di dati dettagliati mantenendo performance, flessibilità e chiarezza visiva.
- LightningChart JS ti consente di eseguire lo zoom del grafico ad alte prestazioni per set di dati di grandi dimensioni, supportando l'analisi in tempo reale con requisiti di precisione e reattività.
Per un'analisi approfondita delle funzionalità e dei prezzi, visita il nostro confronto di JavaScript Charts.