Evidenzia le tendenze con i grafici Heat map
Usa la rappresentazione dei dati basata sui colori per rivelare schemi e anomalie in dataset in stile matrice all'interno di un componente grafico.
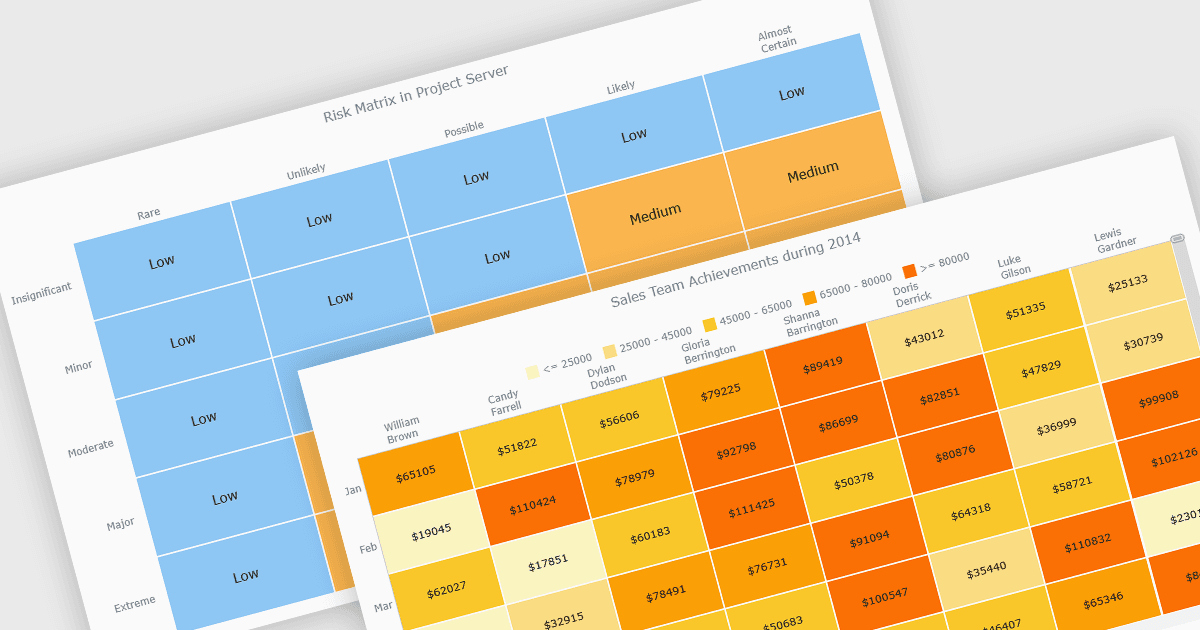
Una heat map è una visualizzazione dei dati che mostra i valori in una griglia di celle colorate, in cui l'intensità del colore rappresenta l'entità o l'importanza dei dati. Questo approccio rende facile identificare rapidamente schemi, tendenze e valori anomali che possono essere difficili da vedere nelle tabelle tradizionali. Le heat map migliorano l'analisi dei dati evidenziando visivamente le relazioni tra due variabili e consentendo confronti rapidi tra diversi dataset. Sono comunemente utilizzate in matrici di rischio, monitoraggio delle prestazioni, analisi delle vendite e tracciamento del comportamento degli utenti, dove le informazioni codificate a colori aiutano gli utenti a concentrarsi sulle informazioni più significative.
Diversi controlli grafici JavaScript supportano i tipi di grafico Heat map, tra cui:
- Highcharts Core di Highsoft consente di creare heatmap interattive che visualizzano dati matriciali con valori codificati a colori, rivelando schemi, tendenze e confronti tra categorie.
- LightningChart JS consente di renderizzare heatmap ad alte prestazioni per grandi dataset, utilizzando l'accelerazione GPU per rivelare schemi, intensità e correlazioni in tempo reale.
- AnyChart JS facilita la creazione di heatmap personalizzabili che trasformano i dati tabellari in griglie codificate a colori, aiutando gli utenti a individuare tendenze, correlazioni e distribuzione dei dati.
- JSCharting consente di creare heatmap interattive che evidenziano l'intensità dei valori tramite gamme di colori, permettendo un rapido confronto, la scoperta di schemi e un'analisi intuitiva.
Per un'analisi approfondita delle funzionalità e del prezzo, visita il nostro confronto dei controlli grafici JavaScript.